


Oops! Something went wrong while submitting the form.

Lierika Nemykina
Customer Operation Department Team Lead
Web analytics forms the backbone of the data-driven approach in digital marketing.
Using a web analytics interface, we can set up data collection and basic reports and create end-to-end analytics solutions. Not only can we upload, merge, process, and visualize your data, but we can also identify growth points for your website and improve your conversion rate.

Data-driven decisions are becoming a key component of business decisions, especially in digital marketing. More than anyone else, digital marketers understand the importance of collecting and analyzing data. But what if there are a dozen different data sources outside of standard reports? How do you deal with all this data?
That's why at Netpeak we have focused our expertise on the right things: we can set up automatic data collection, aggregate your data from all sources, and create easy-to-read reports of any complexity level. You can feel confident knowing that your solution is data-driven.


We set up all necessary parameters, functions, and Google Analytics account notifications. We also create technical requirement documents to integrate Google Ads into your website and link Google Ads and Analytics.
We can implement enhanced e-commerce and set up your website to work with Tag Manager and a data layer. Not only that, we can create a guided technical requirement document to transmit behavioral data to Google Analytics.
We create a guided technical requirement document to transmit behavioral data from CRM and ERP systems, databases, and other external sources to Google Analytics.
We set up all necessary triggers, tags, and variables in Google Tag Manager. Additionally, we create a technical requirement document to implement the tracking codes.
Enable data collection in Google Analytics 4, set up all the necessary events, and prepare technical requirements to import data from your website to the analytics system.
Pre-stage
We can help you decide which data sources to include in the final solution and identify the data, reports, or dashboards that are required. You will also get a diagram of the analytical solution.
Data import
Create special connectors — program codes that import API data and store it in a data warehouse.
Transformation
When data is imported into separate tables in the data warehouse, our SQL code combines and aggregates the data into summary reports.
Visualization
The last step is to visualize the data stored in the warehouse. We build custom dashboards in Google Data Studio, Power BI, and Tableau.
We obtain click data, audience data, data about impressions, and other parameters from advertising systems such as Google Ads, and Facebook Ads.
We export any data from Google Analytics, AppsFlyer and other web analytics platforms for a deep website or app performance evaluation. We then combine it with data on sales and profits.
We process your client and transaction data and combine it with ad campaign data to measure marketing performance.
We process data from your 1C or other automation systems for a deep analysis of the flow of funds or goods.
Google BigQuery — a fully-managed, serverless data warehouse that enables scalable analysis over petabytes of data. It is an excellent and inexpensive solution for storing and processing data from different systems without having to bind it to a physical server.
MySQL — an open-source relational database management system. Most classic business software products for ordinary users are based on MySQL.
PostgreSQL also known as Postgres — a free and open-source relational database management system that emphasizes extensibility and SQL compliance.
Greenplum — a big data technology tool based on MPP architecture and the Postgres open-source database technology.
R — a programming language that's optimized for statistical analysis and data visualization. It is an open-source free software environment within the GNU package.
Python — a general-purpose programming language considered to be one of the best data science tools for big data jobs and machine learning.
SQL — a Structured Query Language, which is a computer language for storing, manipulating, and retrieving data stored in a relational database.
DBT — an open-source command line tool that helps analysts and engineers transform data in their warehouse more effectively.
Microsoft Power BI — one of the most popular platforms for visualizing data and creating interactive charts and reports.
Looker Studio — an online tool for converting data into customizable informative reports and dashboards introduced by Google as part of the Google Analytics 360 Suite Enterprise.
Tableau — an American company that develops software for interactive data visualization and business analytics of the same name.
+32%
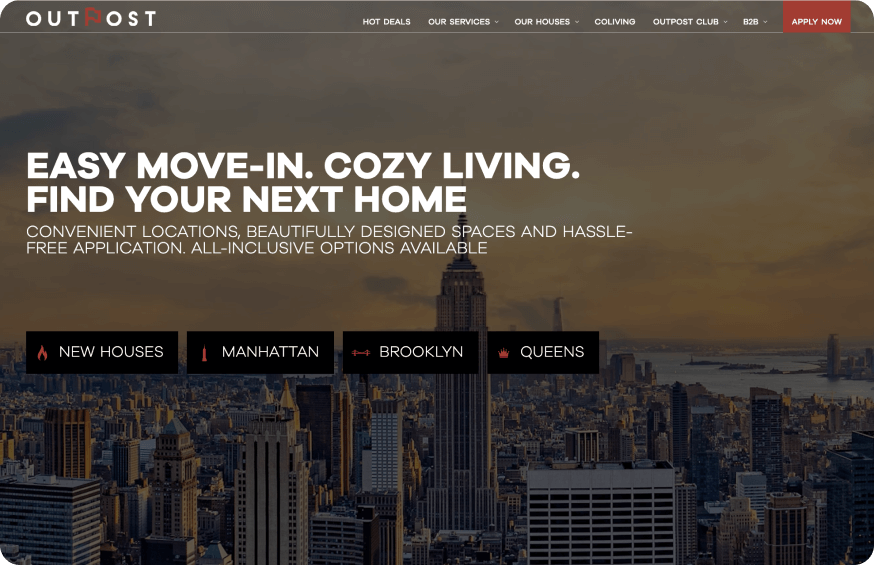
Outpost Club Success Story: How Website Conversion Can be Increased by 32% Within Three Months


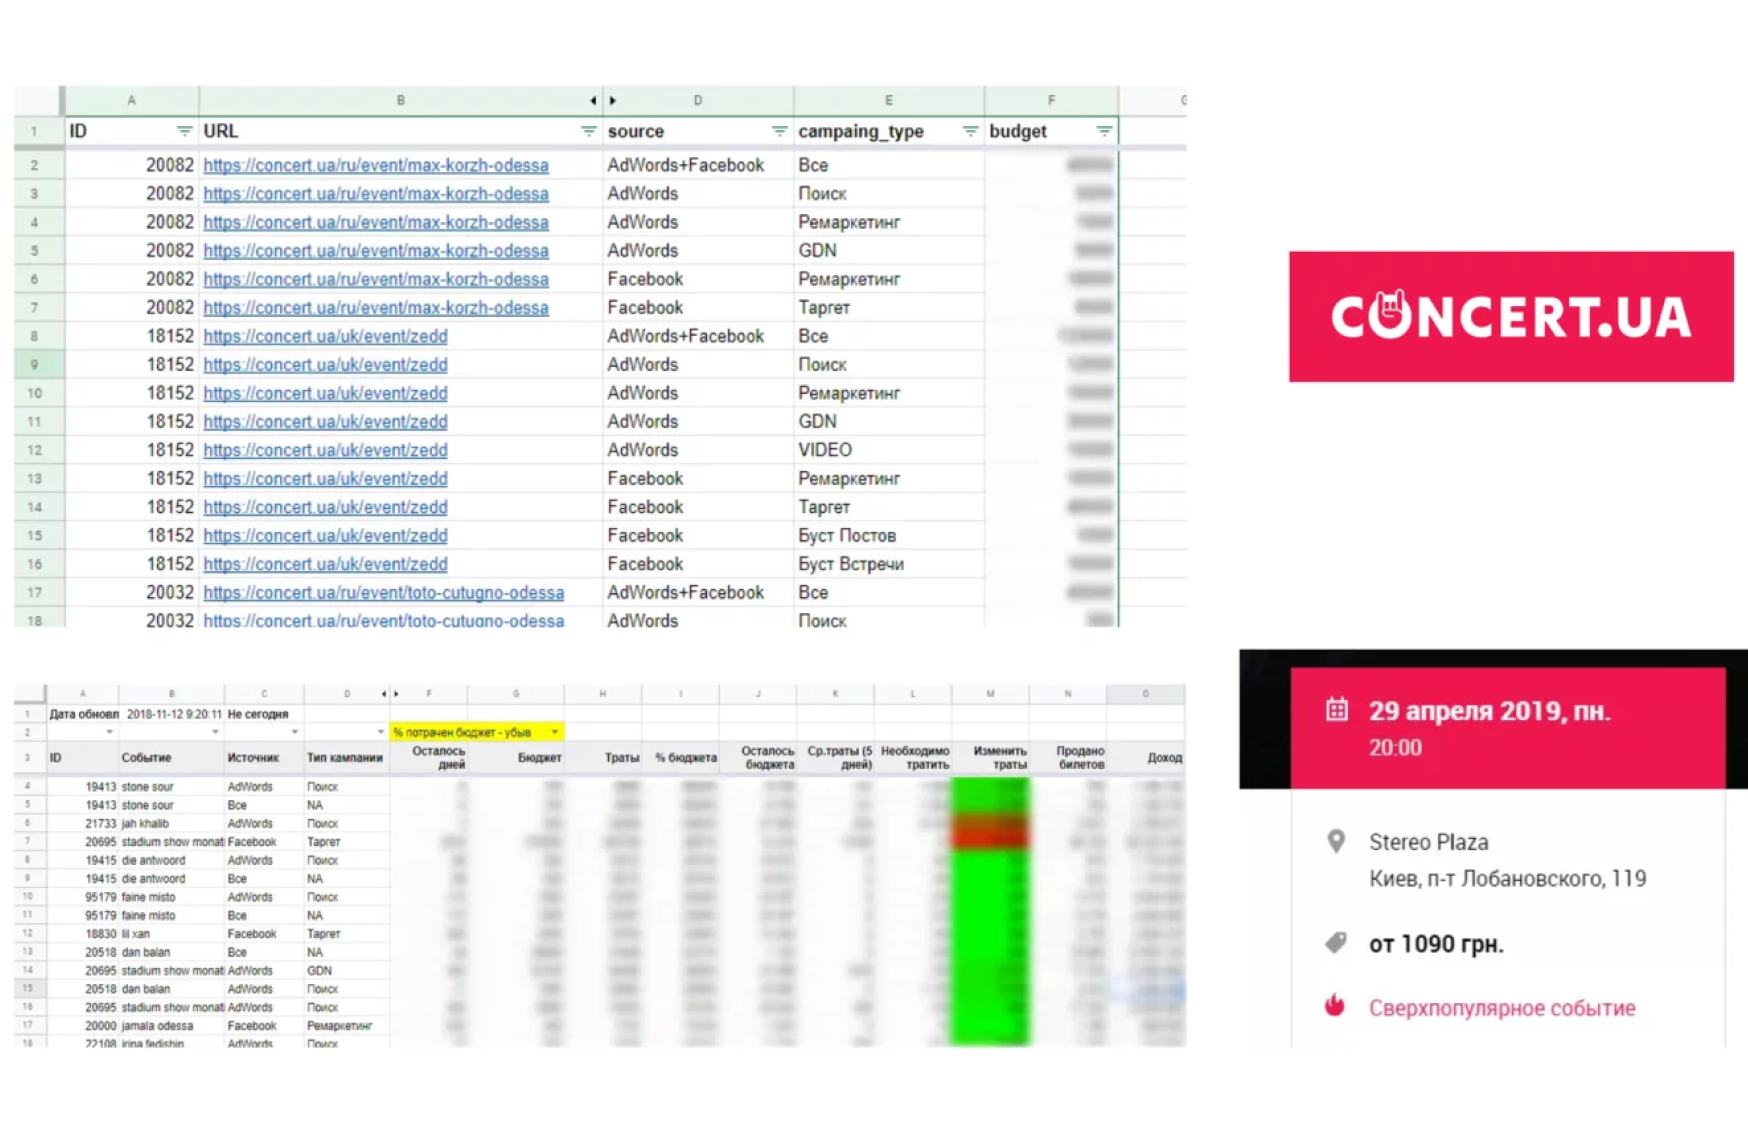
Analytical Tool for Concert.ua – Hundreds of Events Advertising Budgets Controlled in Real Time