With the introduction of Google Analytics 4 (GA4), there are now new ways to analyze websites and applications. However, the transition from Universal Analytics has raised questions about data collection and processing for many users.
Integrating GA4 with Google Sheets is an effective solution: it greatly simplifies data management by automatically sending updates at specified intervals. The GA4 add-on provides ready-made reports and templates and can create new ones according to your requests, offering dozens of metrics and measurements. You can then visualize data in a convenient format without having to log in to the GA4 interface every time.
This article discusses two add-ons for integrating Google Analytics 4 (GA4) with Google Sheets:
-
GA4 Reports Builder, which is the official Google add-on.
-
GA4 Reports by SyncWith, a custom solution from a third-party developer.
Both tools allow you to retrieve and automatically update GA4 data in Google Sheets. However, each tool has its own unique features.
GA4 Reports Builder versus GA4 Reports by SyncWith
Here is a comparison of the two tools:
|
Feature |
GA4 Reports Builder |
GA4 Reports by SyncWith |
|
Availability |
✅Free |
?35 free updates per month |
|
Auto updates |
✅Yes |
✅Yes |
|
Limits on the number of metrics |
✅10 metrics, 9 dimensions |
✅10 metrics, 9 dimensions |
|
Report templates |
❌No |
✅Ready-made templates |
|
Report visual appearance |
? Basic and standard |
✅ Attractive, more user-friendly UI |
Both integration add-ons are based on two key elements: dimensions and metrics.
These parameters are used to configure custom reports for detailed analysis. Both tools support dozens of combinations, enabling you to create flexible and informative reports.
What are “dimensions”?
Dimensions are qualitative data characteristics that describe specific parameters of sessions, users, or events. They show the details of users’ interactions with a website or application.
Common GA4 dimensions
|
Dimension |
Meaning |
|
date |
Date of visit (YYYYMMDD) |
|
country |
User's country |
|
city |
User's city |
|
deviceCategory |
Device type (desktop, mobile, or tablet) |
|
source / medium |
Source and traffic channel (e.g., Google/organic) |
|
eventName |
Event performed by the user: purchase, scroll, video_play |
|
landingPage |
First page visited by the user |
|
pageTitle |
Title of the viewed page |
What are metrics?
Metrics are quantitative indicators that help evaluate the effectiveness of user interaction with a website or application. They answer the questions of "How much?" and "How often?" with regard to user interaction.
Common GA4 metrics
|
Metric |
Meaning |
|
sessions |
Number of sessions (website visits) |
|
activeUsers |
Active users for the selected period |
|
Percentage of visitors who left the website after the first page (bounce rate) |
|
|
engagementRate |
User engagement level |
|
averageSessionDuration |
Average session duration (in seconds) |
|
eventCount |
Number of events performed, such as button clicks and video views |
|
conversions |
Number of conversions: form submissions or purchases |
|
totalRevenue |
Total revenue (for e-commerce analytics) |
Additional filters: dimension and metric
There are two main categories of filters:
-
Dimension filters: filter data by qualitative characteristics, such as country, device, or traffic source.
-
Metric filters: filter data by quantitative values, such as the number of sessions, click-through rate (CTR), and conversions.
These filters help you get more accurate reports by excluding unnecessary or irrelevant data.
Method 1: GA4 Reports Builder (Google add-on)
Step 1: Install the add-on.
-
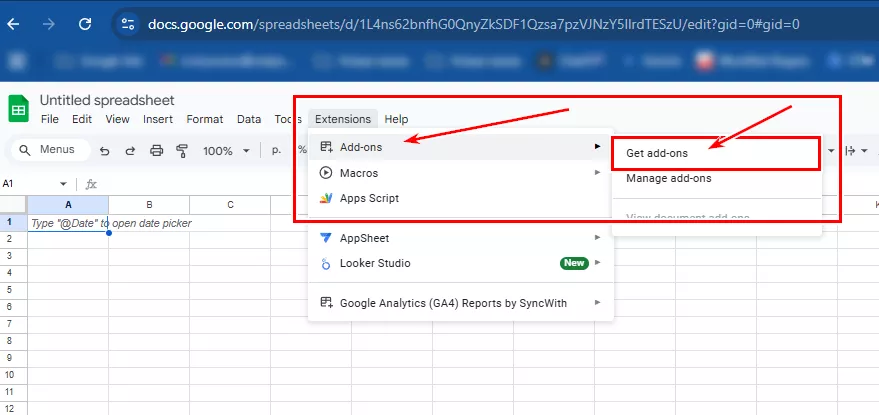
Open Google Sheets. Go to the Extensions tab in the top navigation bar.
-
Select Add-ons, then click Get add-ons.
-
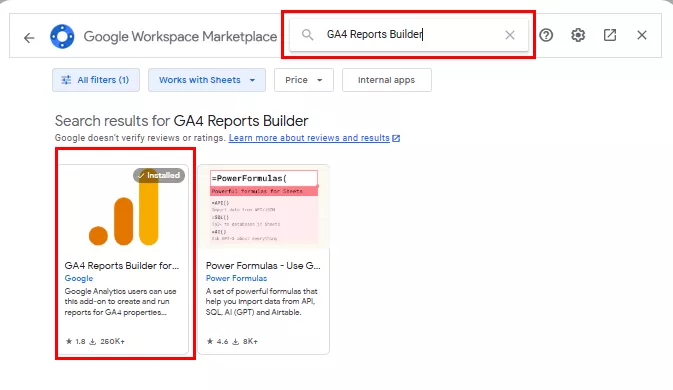
In the search field, enter GA Reports Builder.
-
Find the official Google Analytics add-on and click Install.
-
After installation, grant permission for the add-on to access your GA4 account.
-
Restart Google Sheets to connect the tool correctly.
Step 2: Create a new report.
-
Open Add-ons > GA4 Reports Builder > Create new report.
-
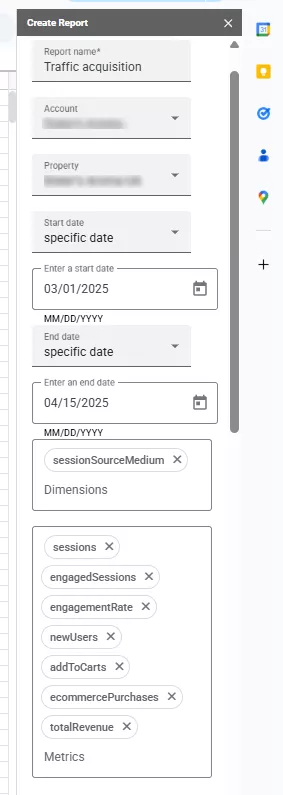
Enter the report name in the side menu, and select the appropriate GA4 account and GA4 property (the analytics resource in GA4). Set the dates.
-
today
-
yesterday
-
NdaysAgo
-
specific date
-
Next, follow the same steps as in the previous add-on to configure the report settings and specify the dimensions and metrics. Click Create Report.
-
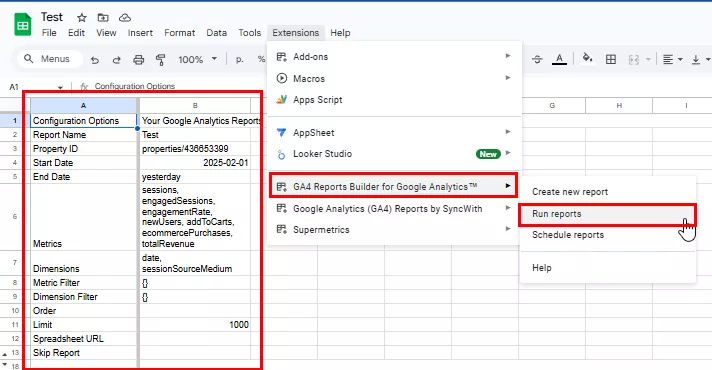
A new Report Configuration sheet will be generated. In the add-on menu, click Run reports.
Results
Once you have completed all the steps, you will receive an automated report containing Google Analytics 4 data in Google Sheets format. It will look like this:
Method 2: Add GA4 Reports with SyncWith
Step 1: Install GA4 Reports by SyncWith.
-
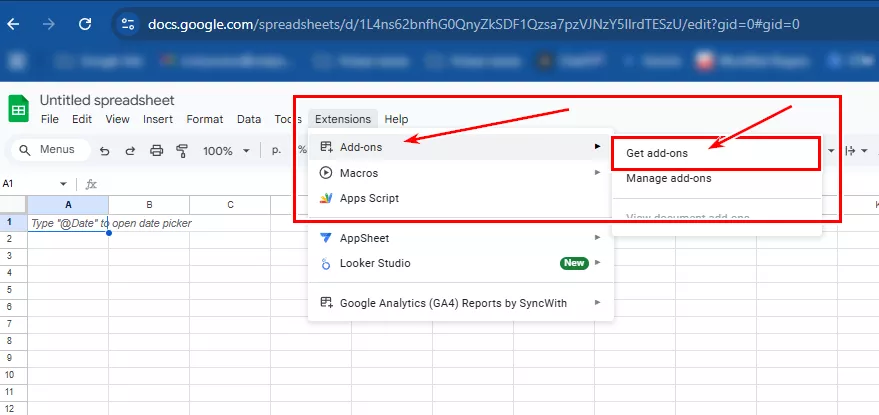
Open Google Sheets. Go to the Extensions tab in the top navigation bar.
-
Select Add-ons, then click Get add-ons.
-
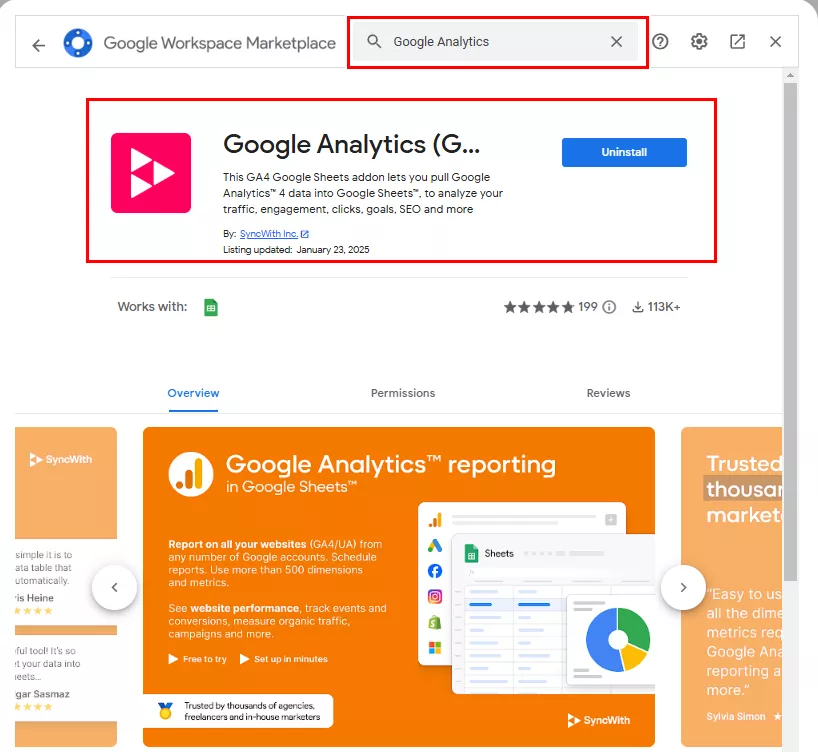
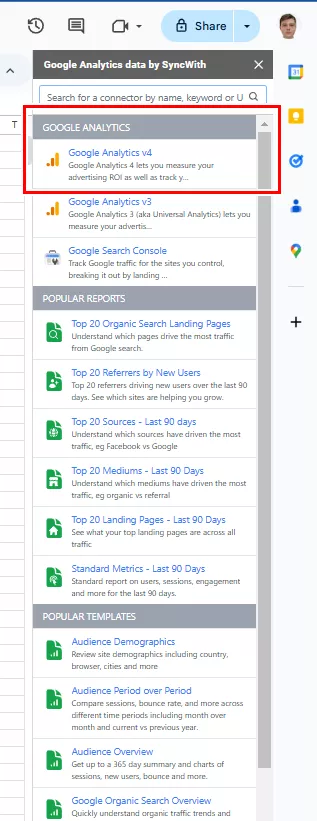
In the search field, type in Google Analytics.
-
The permissions granted must match your Google Analytics account. If you are not an administrator, ensure that you have access to reports in GA4.
Note: If you are using a corporate account, your organization's administrator may have restricted the installation of extensions. In this case, contact your system administrator.
Step 2: Create a new report.
-
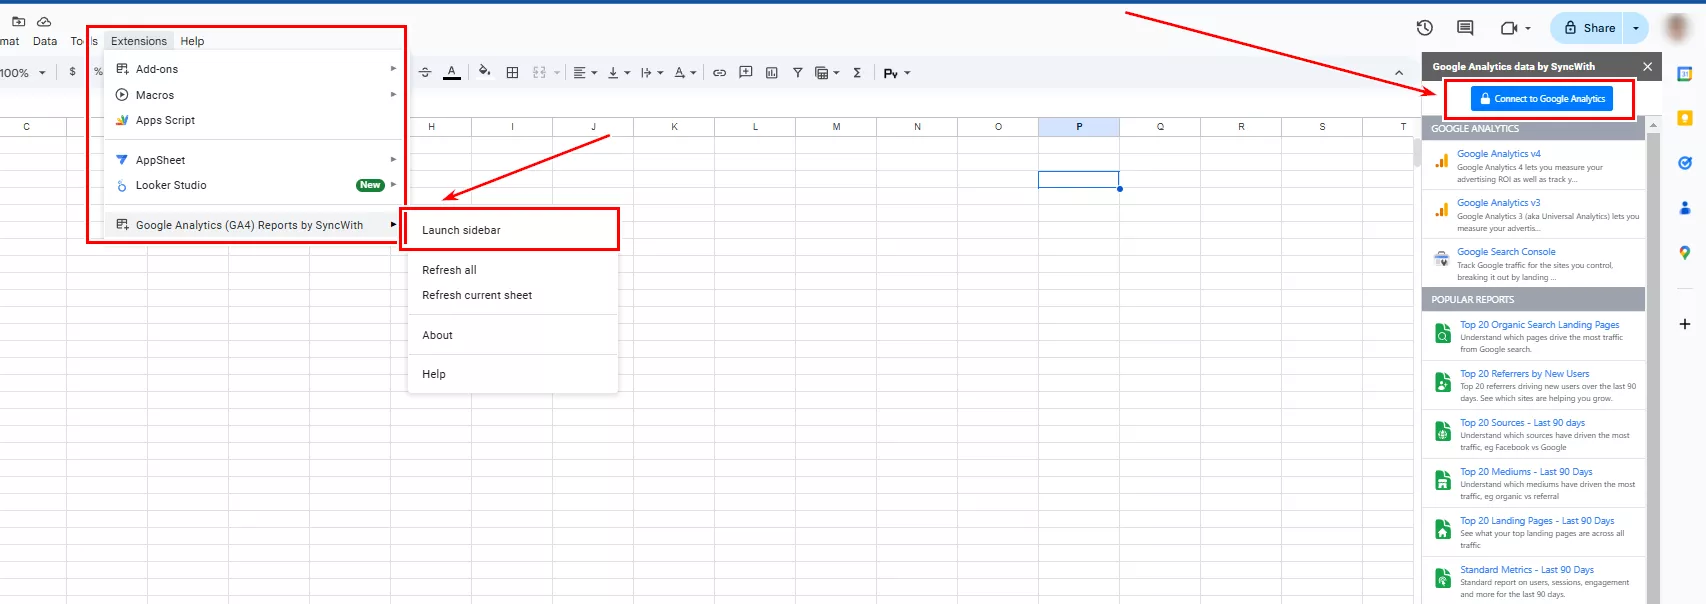
After installing the add-on, connect Google Sheets to Analytics. Go to Extensions > Google Analytics > Launch Sidebar > Connect to Google Analytics.
-
After linking your email to the extension and completing the authorization process, all of your Google Analytics 4 accounts will be available for selection. You can then download data from any selected resource.
-
In the extension's sidebar, you will see several ready-to-use report templates and an option to create your own report with the necessary metrics and segments. In this example, I will focus on creating your own report.
Step 3: Set up the report configuration.
-
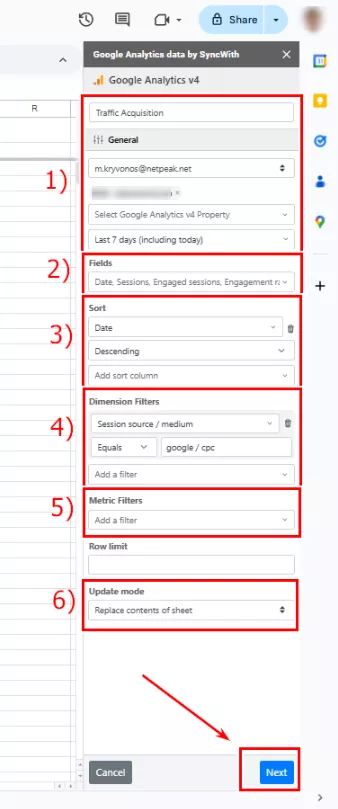
The Report Name is the title of the report. In the same window, select the Google Analytics 4 resource and set the reporting period (date range). For example, you can choose to view data from the last 7 days or month to date.
-
In the Fields section, specify the metrics and dimensions that you want to display in the report.
One of the key advantages of using this extension is the ability to combine metrics from different GA4 segments into one convenient report.
For instance, let's select the user engagement and conversion parameters and segment them by date:
-
Date
-
Sessions
-
Engaged Sessions
-
Engagement Rate
-
New Users
-
Add to Carts
-
E-commerce Purchases
-
Total Revenue
Note: You can include up to ten metrics and nine dimensions in a single query. If you need more data, create a separate query with additional metrics or parameters.
-
In the Sort field, select the metrics for sorting the source data. In this example, the data is sorted by date in descending order.
-
Add filters to narrow down the data in Dimension Filters.
Example: Filter by traffic source.
-
Select the Session Source/Medium parameter.
-
Set the value to google/cpc.
This will allow you to analyze paid traffic from Google Ads only.
-
In Metric Filters, you can set additional filters by metric. For example, you can filter by the number of sessions or other parameters. For this example, leave the field blank.
-
In Update Mode, select how your current sheet will be generated:
-
Replace contents of sheet.
-
Append rows to the end of the sheet.
-
This is useful if you want to keep previous data for analysis.
Step 4: Data update settings
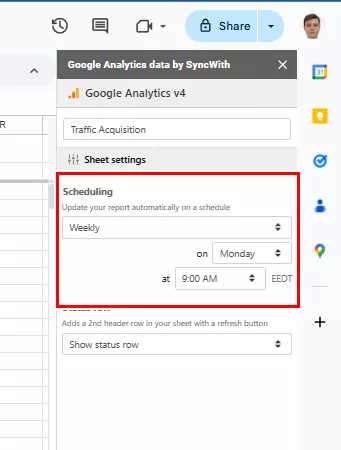
After configuring the report, click Next and set the frequency of data updates.
-
In the Scheduling field, select the desired update mode:
-
Daily: specify a specific update time.
-
Weekly: specify the day of the week and time.
-
Monthly: specify the update date.
-
Hourly
-
Every five minutes: for very dynamic data.
-
I recommend setting the refresh rate based on the importance of the report and data accessibility. For example, Google paid advertising reports will benefit from daily updates so you can quickly analyze changes.
If the import ends in error, check the following:
-
The correctness of the selected metrics and dimensions
-
Access to the GA4 account
-
The date range
Note that GA4 may not support long-term retrospectives like Universal Analytics.
Results
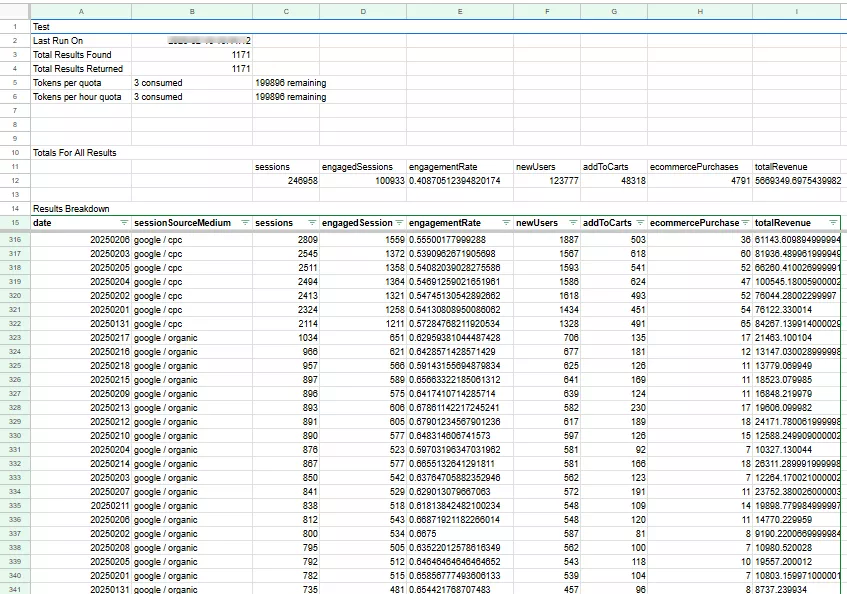
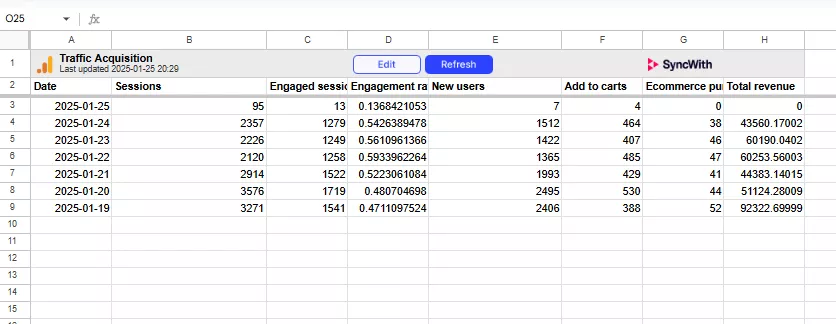
After completing all the steps, you will receive an automated Google Analytics 4 report in a convenient Google Sheets format. The report will appear as a table of values.
-
Date allows you to track changes over time.
-
Sessions refers to the number of visits to the site.
-
Engaged sessions refers to the number of sessions during which users interacted with the content.
-
Engagement rate is the percentage of sessions with interactions.
-
New users is the number of new visitors.
-
Add to carts is the number of items added to the cart.
-
E-commerce purchases are the number of completed transactions
-
Total revenue is the total amount of revenue generated.
Why display Google Analytics 4 reports in Google Sheets?
-
Combine data from different segments. Google Sheets add-ons can combine GA4 segments or reports into a single table. This allows you to see the big picture, which would otherwise require numerous filters and restrictions in GA4.
-
Custom calculations and metrics. Google Sheets lets you create formulas that GA4 doesn't allow. For example, you can calculate conversion rates between segments or the relationship between the number of sessions and revenue.
-
Flexible segmentation. In Google Sheets, you can modify segmentation without creating new reports in GA4. For example, you can break down data by traffic source, city, or country.
-
Convenient for non-technical users. Spreadsheets have an intuitive interface, so reports are easier to use for managers, clients, and colleagues who don't work directly with analytics.
Conclusions
-
GA4 can be integrated with Google Sheets, allowing you to automatically retrieve and visualize data without opening the analytics interface each time.
-
There are two popular add-ons available for integration: the official GA4 Reports Builder and the third-party GA4 Reports by SyncWith. Each add-on has its own advantages.
-
Custom reports are based on dimensions and metrics reflecting the qualitative and quantitative characteristics of user interactions.
-
These reports contain key analytics metrics, such as the number of sessions, engagement, new users, revenue, and purchases.
-
Using Google Sheets has several advantages. You can combine GA4 segments, build your own calculations, add flexible segmentation, and share reports with non-technical users to streamline the web analytics collection.
Recommended theme posts
Related Articles
A Beginner’s Guide to Programmatic Display Ads for E-Commerce Brands
Learn how programmatic display advertising helps e-commerce brands scale reach, retarget cart abandoners and build brand awareness with automated, data-driven campaigns.
Guide to AI Agents for E-commerce: Benefits and Use Cases
Learn how e-commerce AI agents help stores handle support, boost conversions, and save time — with real examples and use cases.
Dentist Review Management: Google Business Reviews Best Practices to Attract New Patients
Learn Google Business review best practices for dentists. Discover how to get more dental reviews, boost ratings, and attract new patients in 2026.

