Google Data Studio has greatly simplified data management by enabling calculated fields. Using the calculated fields feature, you can easily create new dimensions, transform data, and perform mathematical operations. Without this feature, analysis becomes more complicated, as you would have to manually combine data, account for differences in traffic source name spelling, and process non-standard values.
This article will discuss the key features of calculated fields and how to use them for flexible report customization, from basic calculations and text manipulation to advanced functions, regular expressions, and user groups.
- About calculated fields
- Data types
- What's the difference between calculated fields in data sources and chart levels?
- Features of using calculated fields
- Calculated field functions
- Basic mathematical operations with numeric fields
- Using the LOWER(text) function
- egular expressions in calculated field functions
- Using the CASE operator
- Custom groups
About calculated fields
At times, information downloaded from external sources, such as Google Analytics, may not be enough by itself to present data clearly. In such cases, it is necessary to:
-
Add additional metrics
-
Perform calculations based on existing information
-
Create your own variables
To solve these problems, Looker Studio offers calculated fields.
Calculated fields are formulas that perform mathematical, logical, or other operations on one or more fields from your data source to create new values.
Calculated fields allow you to:
-
Perform arithmetic and mathematical operations
-
Process text, time, and geographic data
-
Use functions with branching logic
Data obtained from these calculations can be used for visualization, creating dashboards, and further analysis.
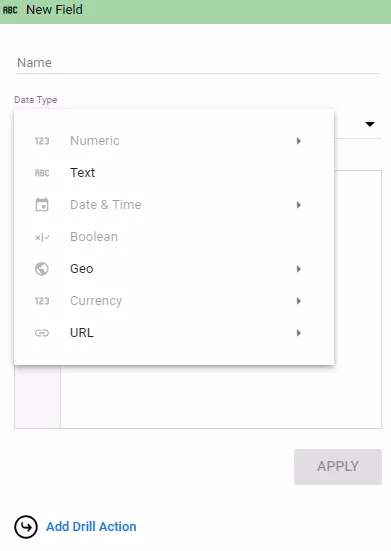
Data types
The data types of calculated fields depend on the functions and dimensions used. There are several different data types:
-
Numeric data types: used for performing mathematical calculations.
-
Text data types: used for processing text data, such as filtering, editing, extracting, changing case, and replacing one piece of text data with another.
-
Date and time: used for working with time intervals, scheduling, and duration calculations.
-
Logical: used for logical expressions, conditions, and data filtering.
-
Geographical: used for filtering by geographical dimensions (city, country, continent, or part of the world).
-
Currency: used for calculations involving monetary values.
The data type depends directly on the functions used in the formula. For example:
-
Numeric fields are created using formulas with arithmetic functions, such as SUM, COUNT, or MAX.
-
Text fields are created using text functions, such as CONCAT, SUBSTR, or LOWER.
-
Date and time fields depend on the used functions; some return numeric values and others return data in the "date and time" format.
See Google Help for more information about data types.
What's the difference between calculated fields in data sources and chart levels?
Calculated fields can be used in charts and mixed data sources. However, only chart-level calculated fields work in mixed sources. Let’s discuss the differences between them and the data source fields.
Calculated fields in data sources
These fields are added directly to the data source and can be used in charts, controls, and other calculated fields. Like regular fields, they support filtering.
However, there are some limitations:
-
For example, you cannot use a calculated data source field with mixed (combined) data.
-
To create or edit calculated fields, you need editing rights for the data source.
-
Additionally, you cannot apply custom formatting to values when creating or editing a calculated field in the data source.
Here’s how you can format the values instead:
-
In the chart's Setup pane, select the desired value.
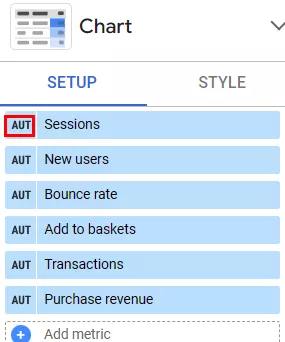
-
Click on the drop-down list of display formats.

-
Then, select the Custom number format option.
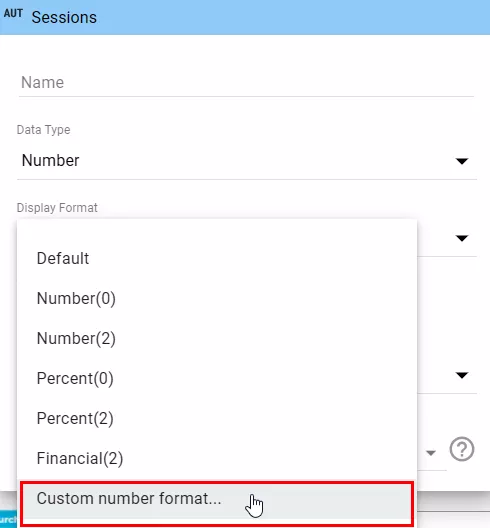
Chart-level calculated fields
The main feature of these fields is that they can be added to a chart. They have several advantages over calculated data source fields:
-
Quick to create. Fields can be added without access to the data source.
-
Flexible. Fields can be created for charts using mixed data.
-
Can be combined. Calculated data source fields can be used within calculated chart fields.
-
Custom formatting. Users can specify the desired format during creation.
Despite their convenience, these fields have several limitations:
-
They only exist in the chart in which they were created. Adding a field to a chart does not update the data source or extend its structure.
-
You cannot refer to other calculated fields in your formula at the chart level, even if these fields were created in the same chart. To accomplish this, you must use calculated fields at the data source level.
-
The report editor role is needed to create these fields.
-
Editing fields in reports must be enabled in the data source settings.
How to create calculated fields
First, carefully review the options available in the tool's right-hand navigation panel.
-
This will help you understand which dimensions can be used in the function.
-
When naming calculated fields, avoid using the same name twice.
To add calculated fields:
-
In the table settings panel, select Add dimension in the Properties block, then click Add calculated field.

-
Enter a name. The name should be informative and concise. Importantly, it should not duplicate existing field names.
-
Enter the formula for the calculation.
For a list of features supported by Looker Studio, see the official Google documentation.
Calculated field functions
These functions allow you to work with data in ways that go beyond simple arithmetic. Looker Studio offers more than 50 of these functions, which are divided into categories.
|
Category |
Usage |
Example |
|
Aggregate functions |
Perform calculations such as summing, searching, averaging, and finding the minimum or maximum number of values. |
SUM, AVG, MIN, MAX |
|
Arithmetic functions |
Perform mathematical operations. |
LOG, POWER, ROUND |
|
Date and time functions |
Create calculations based on dates and times. |
DATE, DATETIME_DIFF, YEAR |
|
Functions of geographic entities |
Process location-related data. |
TOCITY, TOCOUNTRY, TOREGION |
|
Text functions |
Modify and process string data. |
CONCAT, REGEXP_MATCH, SUBSTR |
Now, let’s take a closer look at the operation of popular functions.
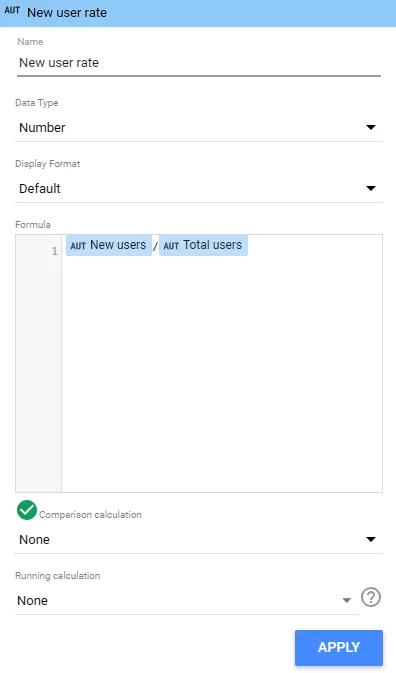
Basic mathematical operations with numeric fields
Here is an example of adding a calculated field with basic arithmetic. Suppose you need to analyze the change in the ratio of new users to existing users in this year compared to the previous year.
-
Click the Create new field button. A console will appear where you can enter the name, field type, and formula. Name the field New user rate. To calculate the number of new users, divide that number by the total number of users.
-
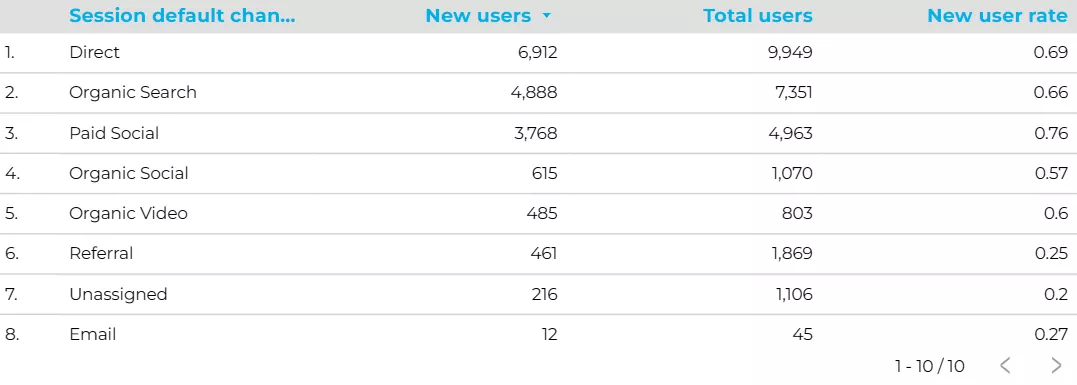
Click Apply. An additional column with the new parameter will appear.
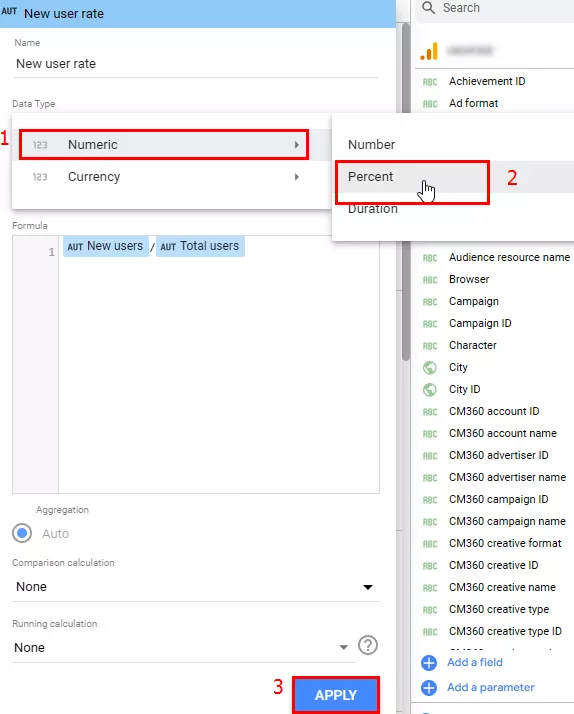
To view the data as a percentage, change the calculated field's data type to Percent and click Apply.
To compare indicators with those from a previous period or year, open the Date range for comparison section on the right panel. Depending on the purpose of the analysis, select one of the following options: Previous period, Fixed dates, or Previous year.

New columns will then appear in the table showing the changes in each indicator compared to the selected period.

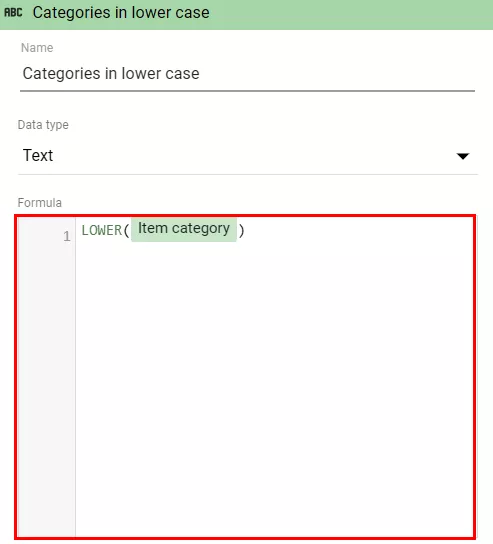
Using the LOWER(text) function
When analyzing campaign data, you may encounter different spellings of campaign names — some are written in lowercase and others in uppercase.
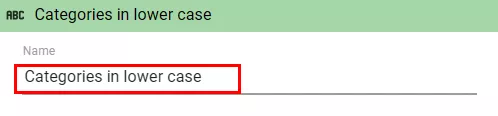
To standardize the names, you can create an additional parameter using the LOWER function in calculated fields, which converts all text to lowercase.
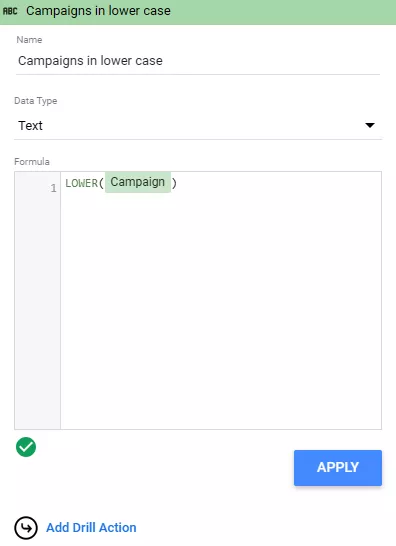
You can also substitute any other value that needs to be converted to lowercase for Campaign.
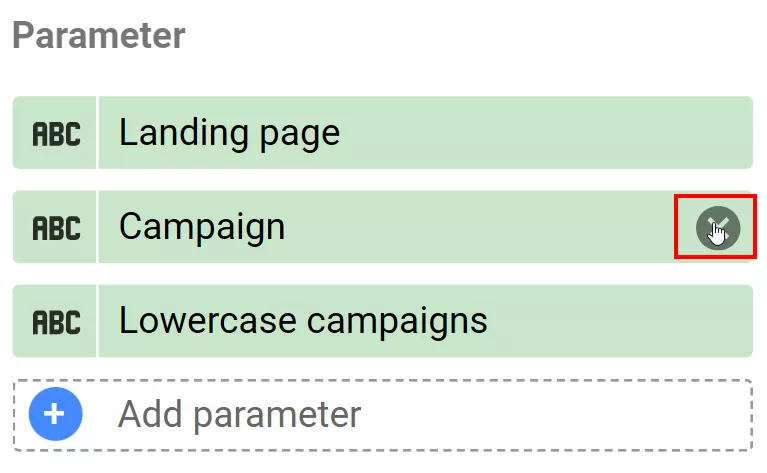
To avoid duplicate values, delete the Campaign parameter in the settings panel, leaving only the Campaigns in lowercase parameter.
Regular expressions in calculated field functions
For professionals who work extensively with data and rely on regular expressions, having the ability to use them in Looker Studio is a highly valuable tool.
This functionality is based on several supported functions:
-
regexp_extract() allows you to extract a part of a field's value that matches a given regular expression.
-
regexp_match returns true if the field value matches the specified regular expression and false if it does not.
-
regexp_replace() replaces all values in the specified field with the value specified in the function.
-
regexp_contains() is similar to Regexp_match, but regexp_match matches the entire value by default while regexp_contains can search for part of the value.
Let's look at an example where you need to analyze what users are searching for on the website using the internal search function. First, filter the data by the parameters in the URL of the internal search results pages. In our example, the parameter is ‘search=’. You can add the filter in the right panel of the table settings in the Data section. The filter settings will look like this:

To understand what users are searching for, it is a good idea to extract the search query from the URL. To do this, use the function regexp_extract(full URL of the page,‘search=(.*)’).
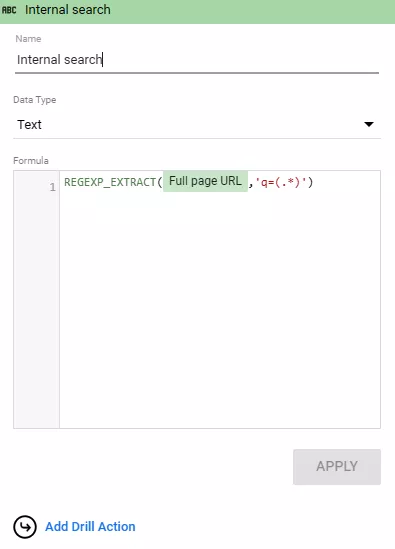
The result will be displayed in a new column of the chart or table, labeled with the name of the calculated field. In this case, the name is Internal search.
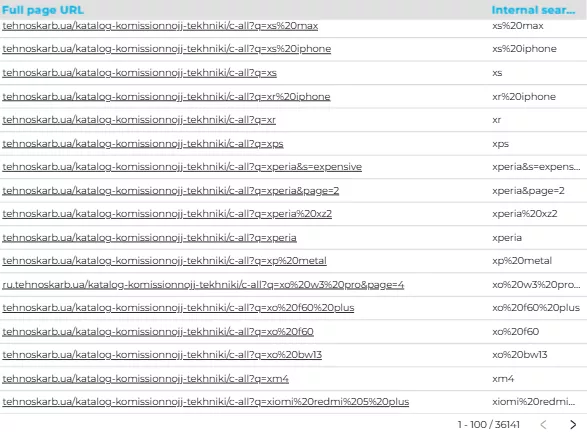
It is now much easier to analyze what users search for on the website and how often.
Using the CASE operator
The CASE operator is one of the most powerful operators because it allows you to manipulate parameters and indicators. It is typically used to create new categories or data groups.
Operator syntax:
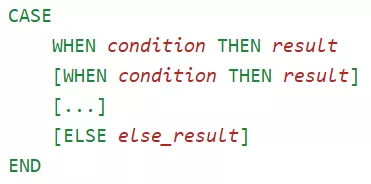
-
condition is an expression that evaluates to a logical value (true or false). It can include parameters or metrics, but not both at the same time.
-
result is the value that will be returned. It can be a parameter, metric, or any required value.
-
else result (optional) is the default value that is returned if the condition from the WHEN block is not met.
A CASE statement consists of one or more logical conditions (WHEN) followed by the result that is returned when the conditions are met (THEN). If the conditions are not met, the CASE statement returns the value specified in the ELSE clause.
A detailed guide to the CASE statement can be found in the official Google documentation.
Here are a few examples.
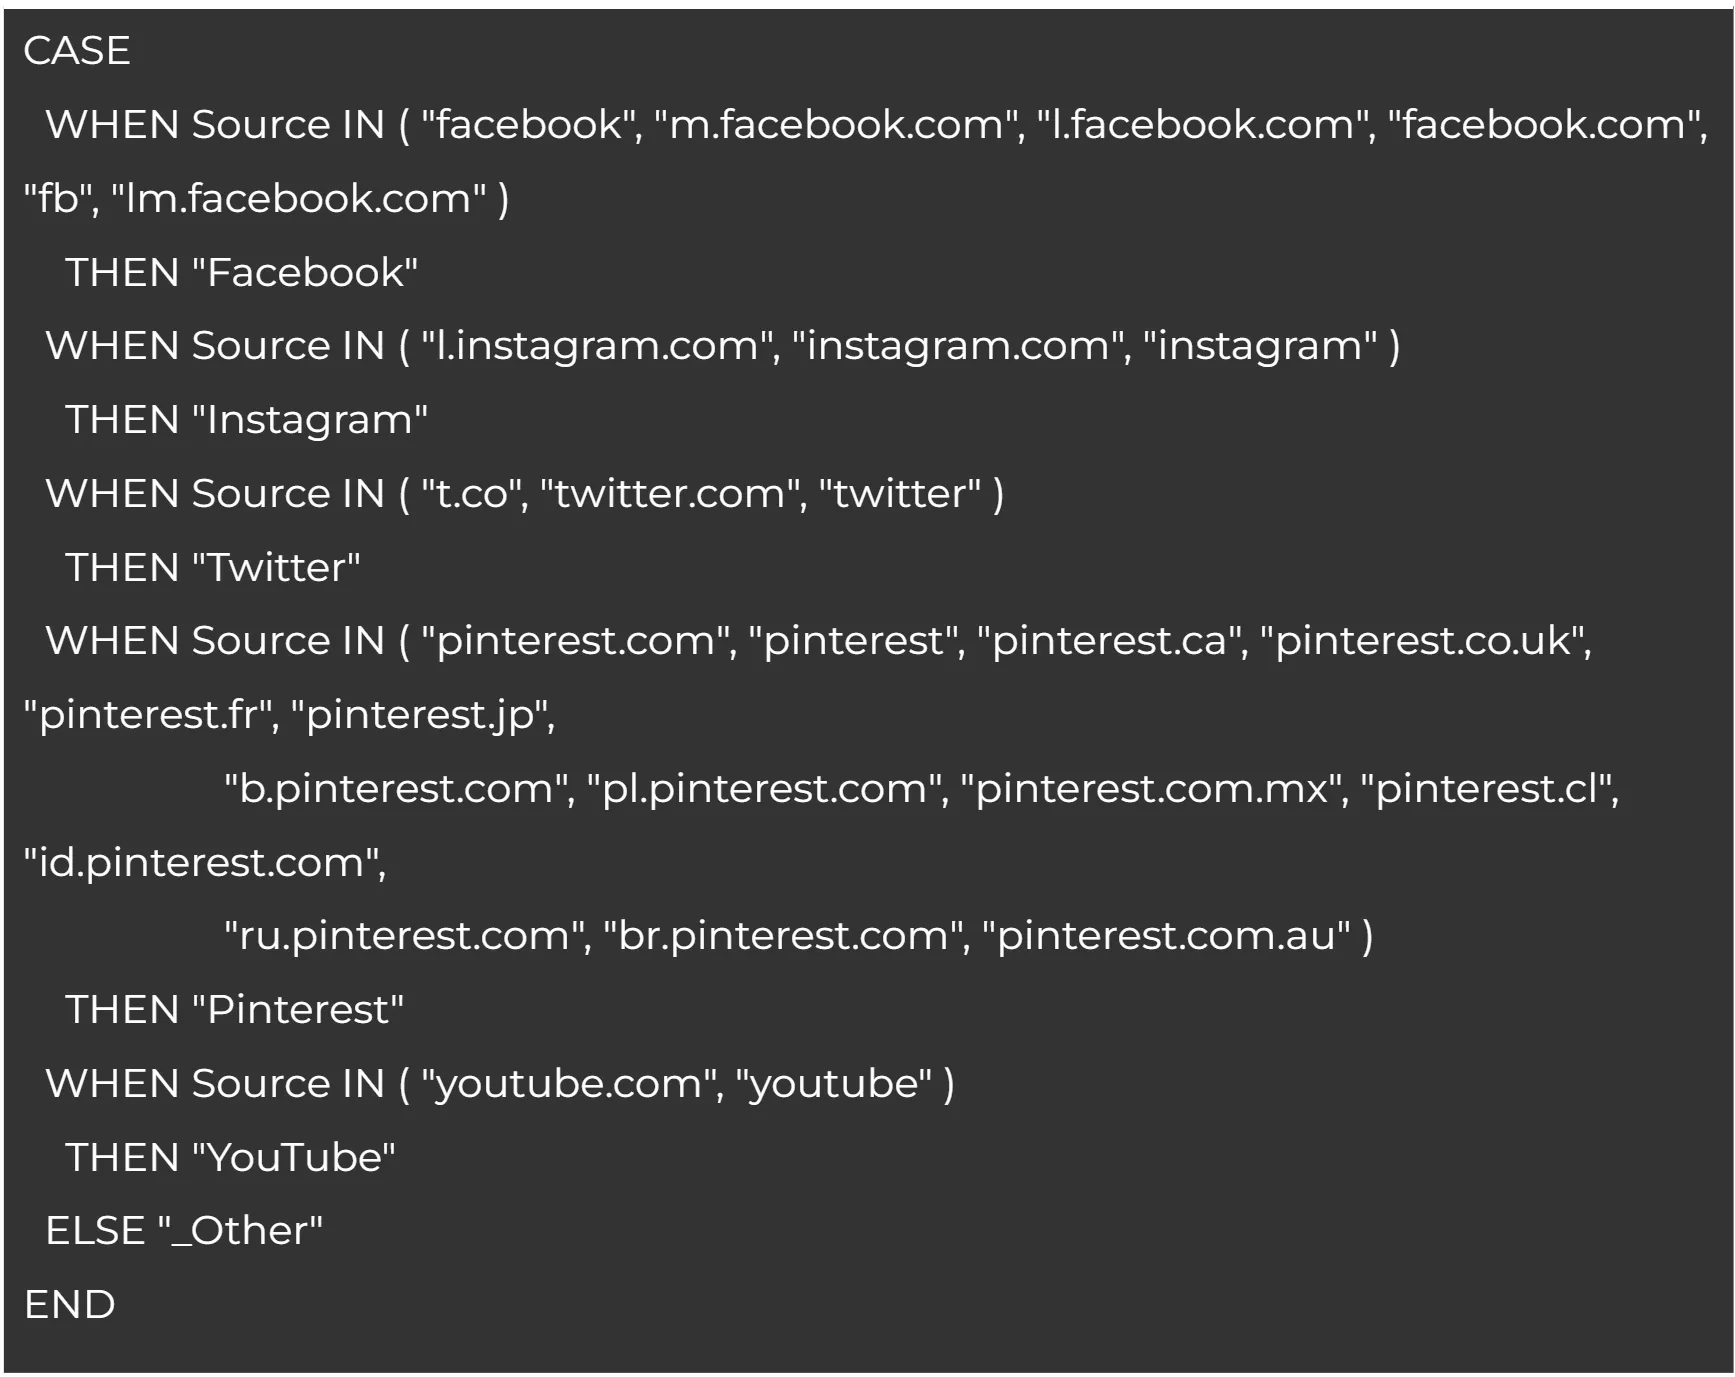
Imagine you need to analyze data on how users found the site. The lower function solves the problem of upper and lowercase, but it doesn’t address the problem of different names for the same source.
For example, "Facebook" can appear in the following forms: facebook, m.facebook.com, l.facebook.com, facebook.com, lm.facebook.com, and fb.
To standardize these values, you need to use the CASE WHEN function.
Add the formula to the settings in the right panel.
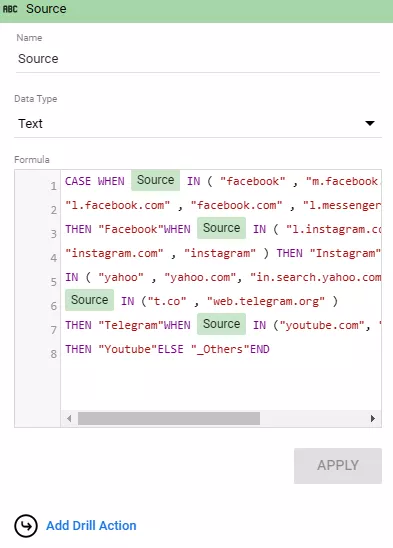
To avoid duplicates, only the newly created field should remain.
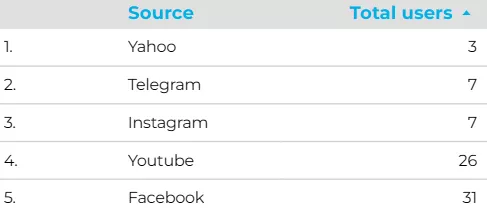
Specifying all possible variations of a source in the WHEN condition allows you to convert them to a single format.
Another significant advantage of the CASE operator is its ability to set conditions using regular expressions. In this example, the regexp_extract, regexp_match, and regexp_replace functions are used simultaneously.
If you are analyzing statistics by page type, the condition would look like this:
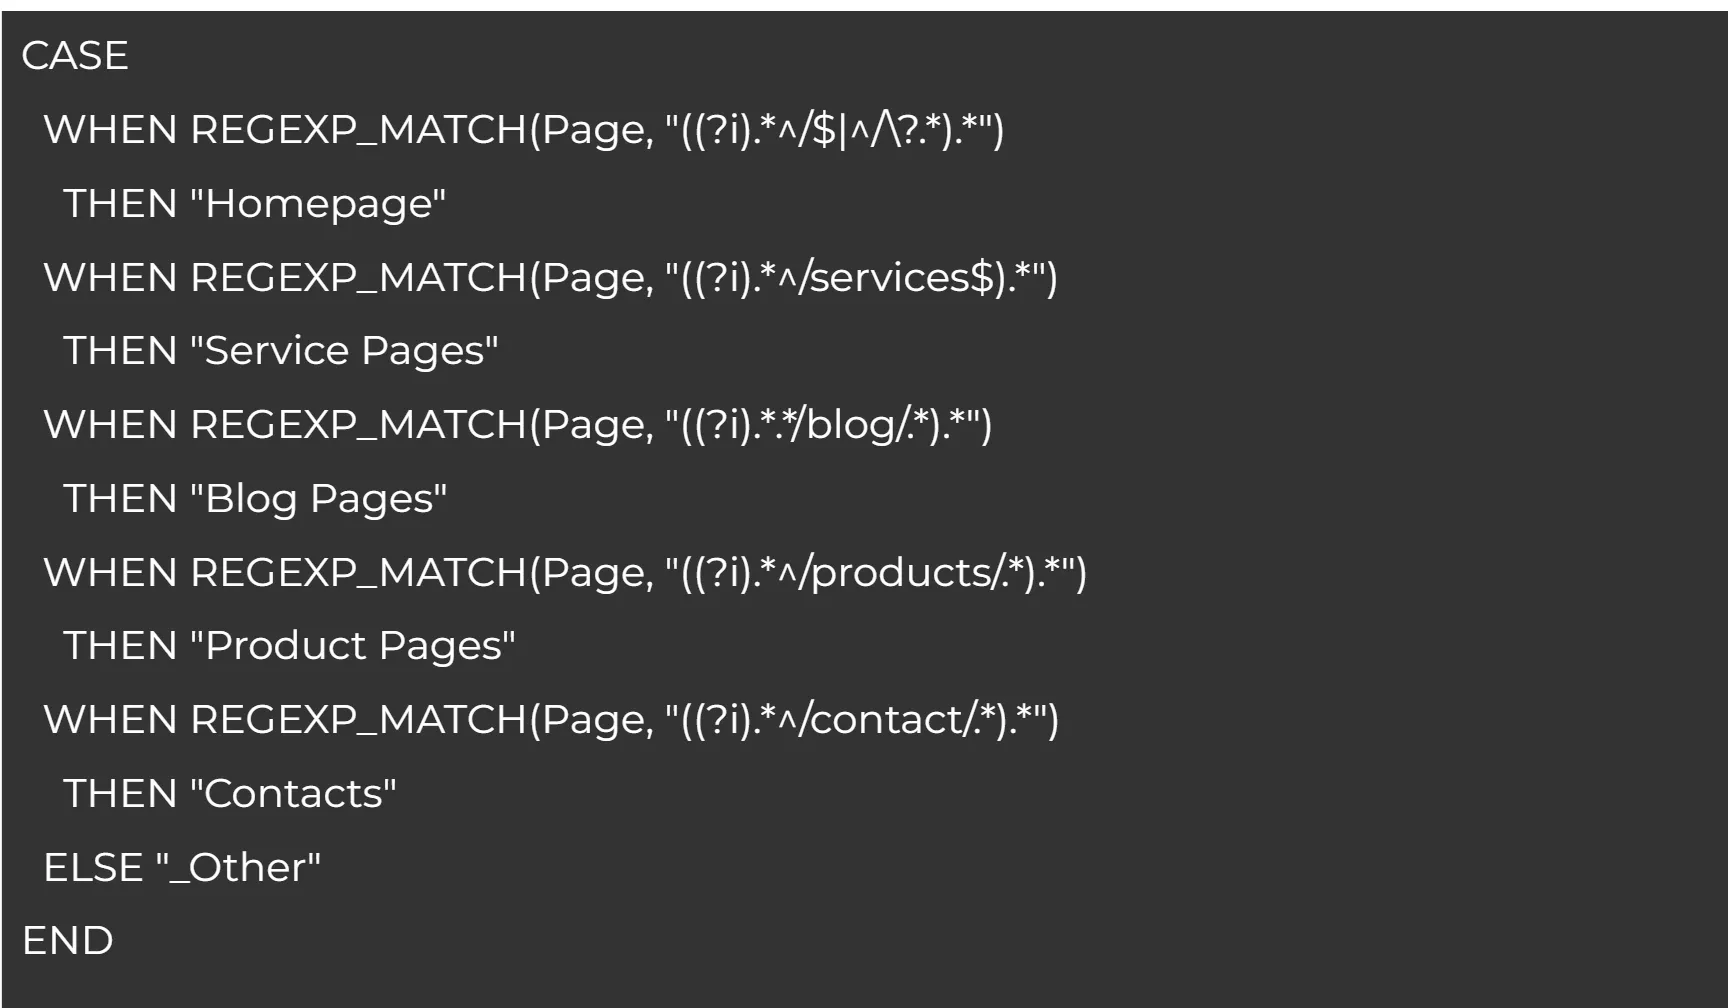
As you fill in the function conditions, the system automatically checks the data, eliminating the possibility of errors. The system also offers options for selecting fields for the new parameter and provides prompts for entering the source data correctly.
Note: Regardless of the calculations or changes made, the source data remains unchanged. You can always return it to its original form.
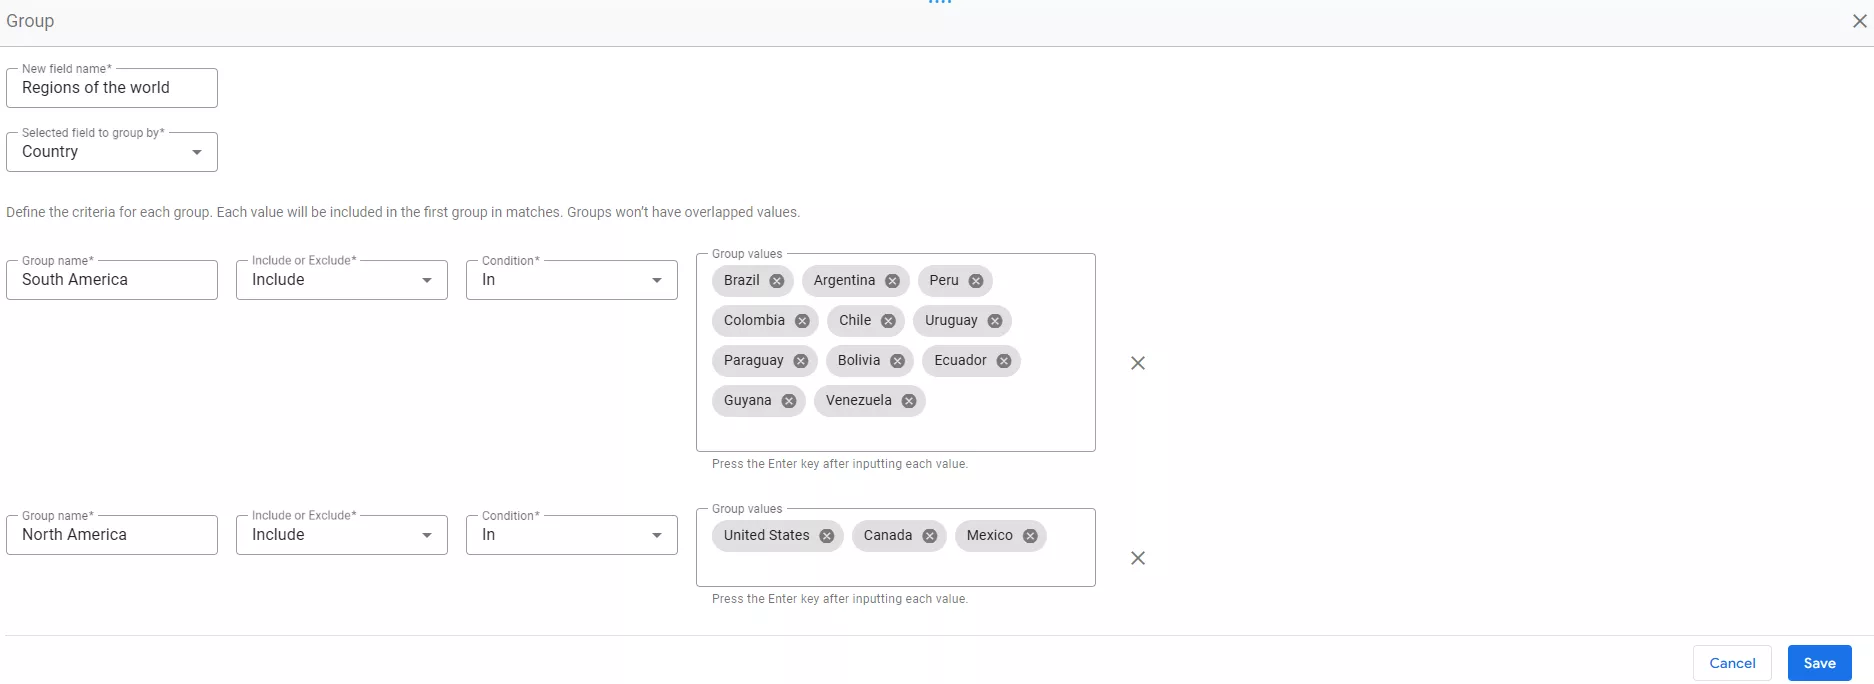
Custom groups
These enable you to create individual custom segments without using CASE or SQL. They are useful when you need to assign fixed labels or categories to values that meet specific conditions.
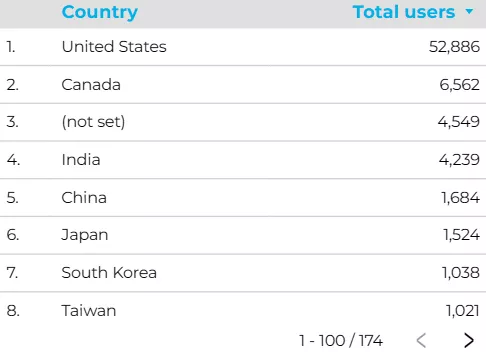
For example, imagine you have a report on new users by country and need to organize it by world region.
This parameter is not included among the data sources. However, you can create a custom group and combine certain countries into the corresponding parts of the world. To do so, follow these steps:
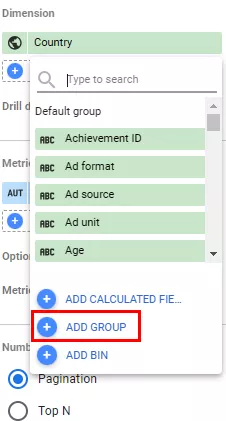
-
In the panel on the right, select Dimensions and click Add group.
-
Set the required parameters.
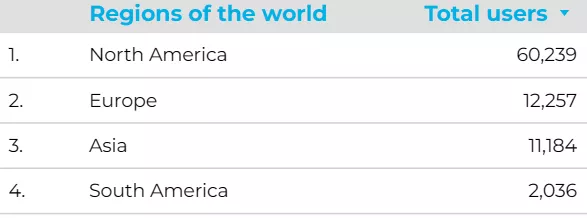
-
Apply the newly created field.
Conclusions
-
By allowing you to create additional parameters and metrics, calculated fields in Looker Studio help simplify data analysis.
-
Several data types are supported, including numeric, text, date and time, logical, geographic, and currency.
-
Calculated fields can be used to perform basic calculations and actions, as well as complex functions.
-
One of the most common functions for working with text data is LOWER, which converts text from uppercase to lowercase.
-
The regexp_extract, regexp_match, regexp_replace, and regexp_contains functions allow you to use regular expressions to create new variables and parameters.
-
The CASE operator is most often used to create new categories or groups of data.
-
These custom groups consolidate data based on existing parameters. Not only do they simplify report analysis, they also make reports more informative for marketing purposes.

 0
0
 0
0
 0
0
Recommended theme posts
Related Articles
Online Local Advertising for Small Businesses: How Neighbors Find You Online
Discover how small businesses use online local advertising to show up in search, maps, and social feeds — and turn neighbors into customers.
How to Do SEO for a Cleaning Company in 2026? From Invisible to Fully Booked
If you do it right, cleaning service SEO becomes your most sustainable growth channel — bringing in clients, lowering acquisition costs, and building long-term online visibility.
13 Leading Healthcare Marketing Trends for 2026
Discover the 13 hottest healthcare marketing trends in 2026 that will help your brand stay ahead, engage patients, and drive results. Stay smart, stay relevant!