It’s crucial for a business to understand its customers' preferences and behavior. Not only will this help improve its service, but it will also allow the business to more effectively develop its marketing strategy.
This article discusses how RFM analysis helps businesses identify their most valuable users, optimize their resources, retain existing customers, and attract new ones.
What is RFM?
RFM was first used over 25 years ago by U.S. catalog companies, including Land's End, Charles Tyrwhitt, and JCPenney. These companies used RFM to minimize delivery costs and increase sales profits.
RFM analysis is a proven method of segmenting customers based on when they last made a transaction, how often they purchase, and how much they spend. It helps businesses identify the most valuable customer segments to optimize marketing strategies.
In RFM, customers are categorized based on three main criteria:
-
Recency: When did the customer last make a purchase?
-
Frequency: How often does the customer make purchases?
-
Monetary: How much money does the customer spend?
What data do you need for segmentation?
The larger the dataset, the more accurate the results. Instead of creating a separate database for RFM analysis, you can use Google Analytics 4, which provides powerful tools for tracking traffic metrics and user behavior on your website or app.
For convenience, you can automate the process of collecting and uploading data from Google Analytics 4 to Google BigQuery by integrating the two tools. Once set up, data is automatically sent to the specified Google BigQuery database.
Use Python and the following libraries to process metrics and segmentation:
-
Pandas for loading and processing data.
-
Scikit-learn for analysis and machine learning.
-
NumPy for working with data arrays.
-
Matplotlib and Seaborn are used for visualizing the results of the analysis.
Read more on how to bypass the one million limit on event exports from Google Analytics 4 to Google BigQuery.
Data preparation: An e-commerce business example
The effectiveness of RFM analysis depends heavily on the quality of the data preparation. Errors or omissions at this stage can significantly impact the results and lead to incorrect conclusions. As an example, here is a step-by-step data preparation process for an e-commerce business that analyzes user purchases.
Data preparation stages:
-
Downloading and processing.
Use the Pandas library to download the .csv data obtained from Google Analytics 4.
data = pd.read_csv("output_data.csv", parse_dates=[’event_date’],
date_parser=lambda x: pd.to_datetime(x, format=’%Y%m%d’), dtype=dtype_mapping)
-
Structure analysis.
Examine the dataset containing information about transactions in the online store. Each record in the dataset represents a user purchase and contains the following key variables:
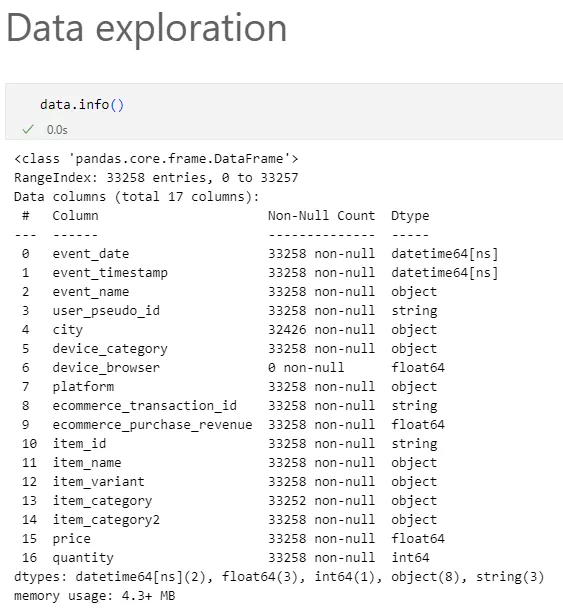
This dataset contains 33,258 records and 17 variables of different data types, including numerical (prices and quantities) and categorical (city, browser, product category, and date).
-
Analysis of unique values.
Count the number of unique values in each non-numerical variable to get insight into the diversity of the data.
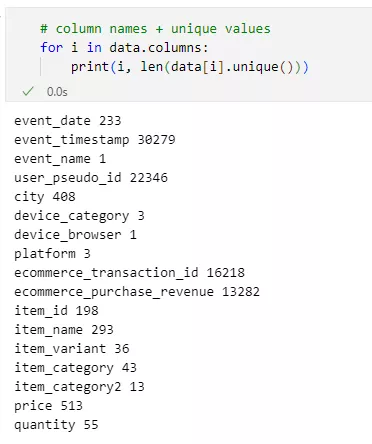
Since the variable device_browser contains a single unique value, it will not affect the results and can be removed. It does not contain any variability, so including it in the analysis does not provide additional information about customer segmentation or behavior. The event_name variable also has a single unique value: purchase. In other words, the input dataset has already been filtered to contain only users who have made a purchase.
-
Analysis of missing data.
Missing values in variables can have a significant impact. Therefore, it is important to identify and address them.
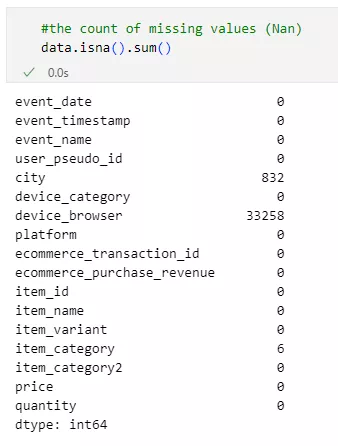
Missing values were found in the city, item_category, and device_browser variables.
-
Descriptive statistics.
After verifying the structure and uniqueness of the data values, it is important to evaluate the numerical indicators.
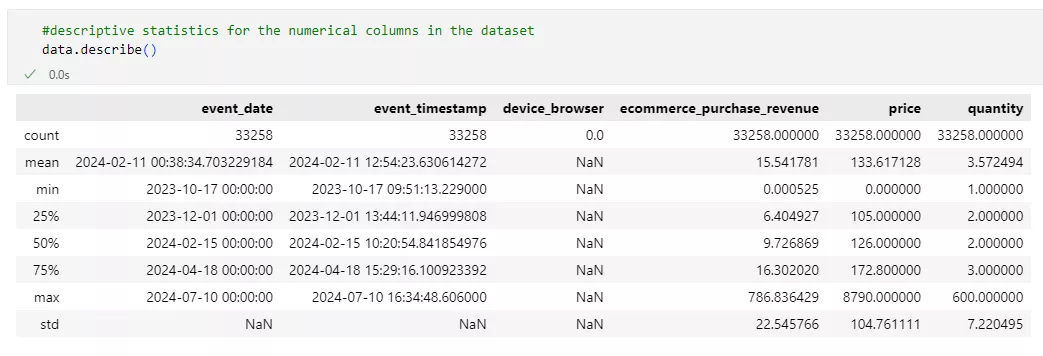
Descriptive statistics help us understand the distribution of key variables and identify potential anomalies. This is especially important in fields related to income and price because significant deviations can affect the quality of user segmentation.
After analyzing the obtained indicators, we can draw the following conclusions:
The available data spans approximately nine months, which is a fairly large sample size for identifying trends and assessing customer behavior over a long period.
The minimum value for ecommerce_purchase_revenue is 0.000525. A value this low may indicate test transactions, micropayments, or incorrectly processed transactions. This is important because these types of transactions can distort average revenue values and affect the segmentation of user groups.
A high standard deviation of 22.55 indicates significant variability in revenue, confirming large fluctuations in purchase amounts among different customers. This may result from the natural distribution of expenses and abnormal values, both of which are important to consider in further data processing.
The presence of zero or very low prices may indicate errors in the records or a promotion providing the product for free. The maximum price value is 8,790.0. This suggests that there are several expensive products, which may be due to data errors or rare items with high prices.
The maximum quantity value is 600, indicating either abnormally large orders or data errors.
Taking these findings into account, the next step is to process all detected anomalies, including low and zero revenue values and extreme variations in price and order quantity. This will eliminate possible errors and ensure the accuracy of the RFM analysis.
-
Data cleaning and preparation.
Thedevice_browser column is removed because it contains all missing values.
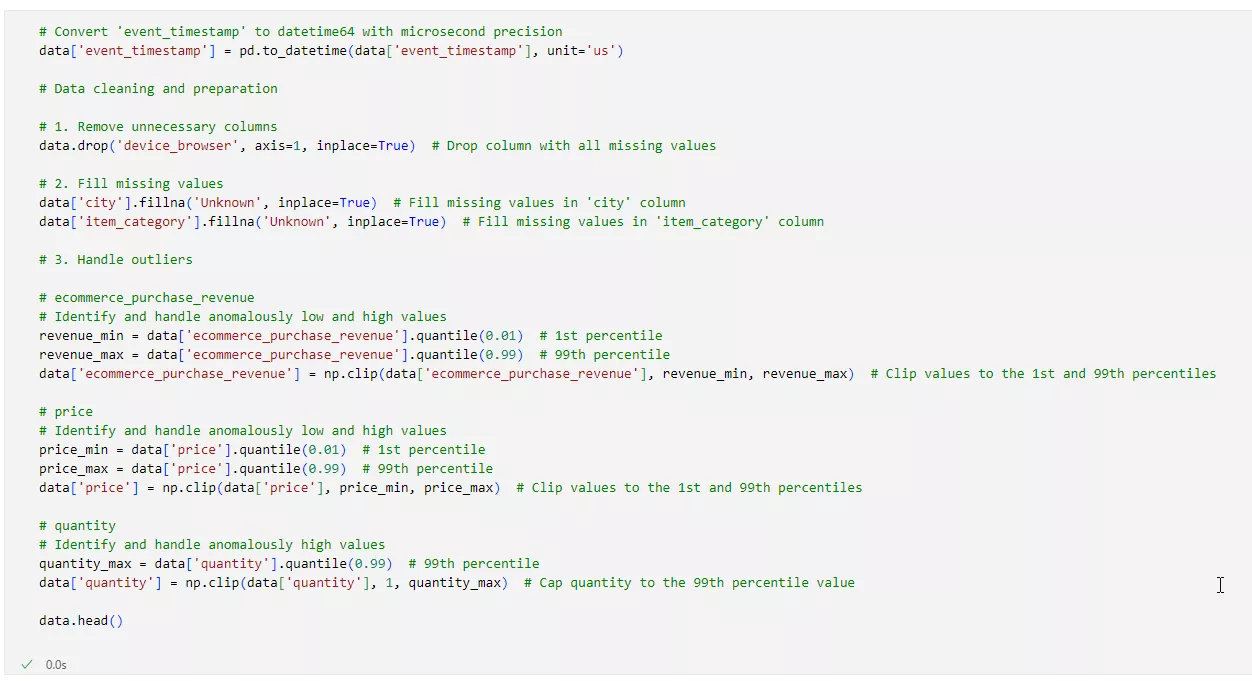
Missing data in the city and item_category columns is replaced with the value Unknown.
Abnormal values are handled:
-
For ecommerce_purchase_revenue and price, the first and 99th percentiles are used to determine the acceptable range of values.
-
For quantity, a maximum value is set based on the 99th percentile.
Once data processing is complete, the data is ready for RFM analysis and further user segmentation.
The practical value of RFM analysis
RFM analysis offers several benefits. It allows you to:
-
Identify the most loyal customers.
-
Develop personalized marketing strategies.
-
Optimize marketing costs.
-
Increase customer satisfaction.
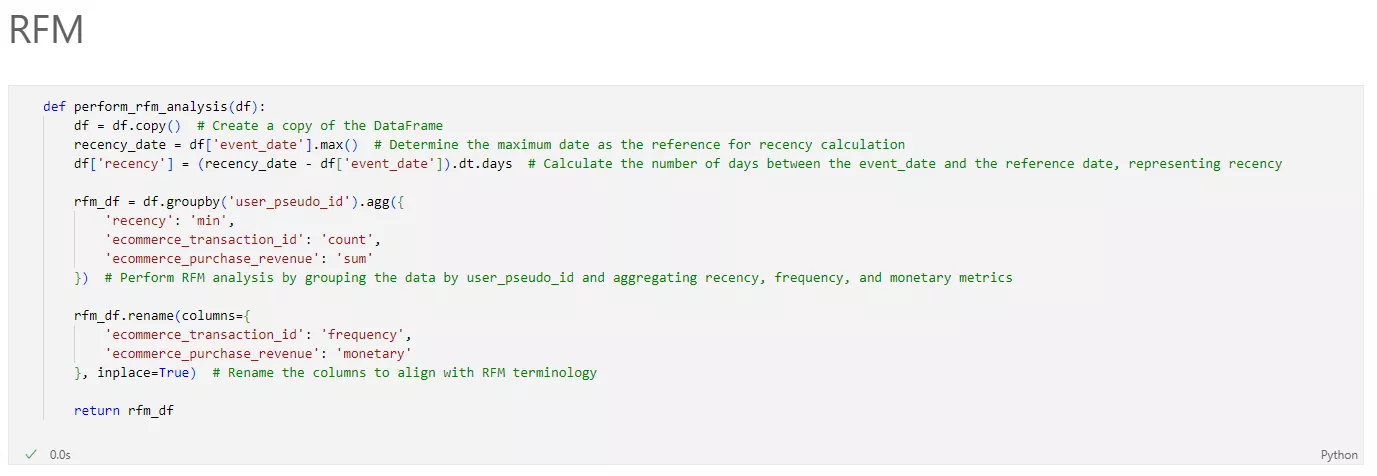
Here is an example of code for performing RFM on collected data:
Visualization of RFM analysis results
To visualize the findings of RFM analysis, you can use boxplots and histograms. Boxplots show data distribution and highlight anomalies, while histograms demonstrate the frequency of values.
Analysis of results
The results provide insights into customer behavior and the value they add to the business.
-
Recency: buyers with low recency values are the most active.
-
Frequency: customers with high frequency values buy often.
-
Monetary: users with high monetary values generate the most revenue.
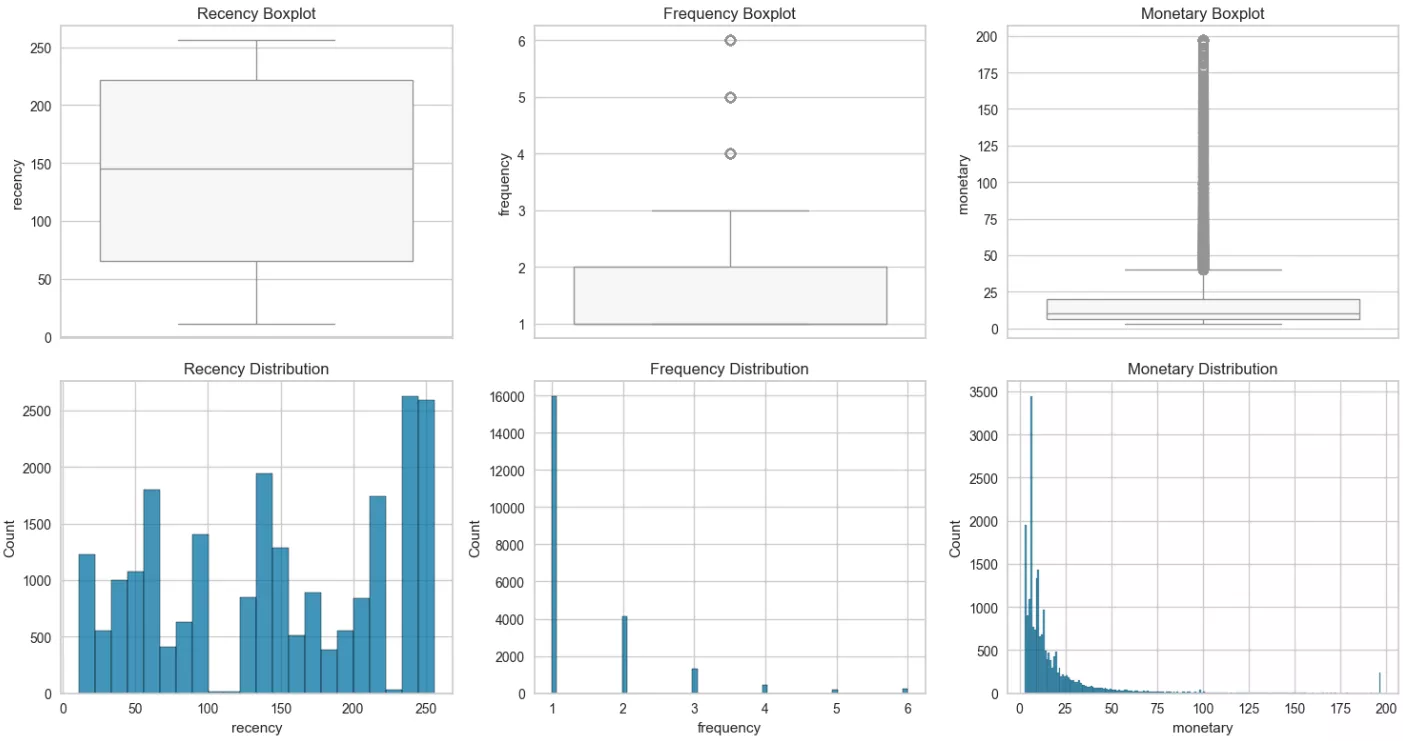
The quartile data obtained for each metric (recency, frequency, and monetary value) indicate the following:
-
Recency. The median value of 145 days indicates the average customer activity period, and the 75th percentile value of 222 days shows that some users may have made purchases up to seven months ago.
The maximum value (256 days) shows that the least active buyers made their last purchase a fairly long time ago. Seasonality of purchases should be considered here. -
Frequency. The frequency of purchases suggests that most customers made only one or two purchases during the entire period. The median of 1.0 confirms this, as a significant proportion of users purchased very infrequently.
The maximum value of six shows that some customers may have purchased up to six times. These purchases appear to be made on an as-needed basis, which is typical of goods not consumed daily. -
Monetary. The 25th percentile ($6.43) and the median ($10.34) suggest that most purchases are relatively inexpensive.
However, the 75th percentile ($19.99) suggests that a significant proportion of buyers spend more. Some indicators reach a maximum value of 196.96, which may be due to industry-specific factors, such as large one-time orders.
Clustering with K-means
K-means is a powerful data analysis tool that allows you to divide a large number of customers or products into groups based on similar characteristics.
By identifying objects with similar behaviors and characteristics, it allows you to apply specialized marketing and product strategies to each group.
In addition, by segmenting users according to product categories and the time of their last transaction, you can identify customers who need promotions to increase their order frequency. You can also identify users who can be encouraged to shop again with special offers.
First, prepare the data:
-
Code categorical variables. The algorithm can only operate on numerical data. Therefore, you must first convert all string variables. For example, city, device type, or product category.
-
Scale the numerical data. Numbers representing purchase frequency, amount, or time since the last purchase must be converted to a single scale.
Using this tool to perform RFM segmentation for your business is easier than reading a star chart for a horoscope. In this way, you can even determine that Aquarians are flighty, Virgos are picky, and Capricorns are stable buyers. :)
Examples of segmentation:
-
Champions (high R, high F, and high M). Active and generous, they constantly return for new purchases and are not afraid to spend a lot of money. They are the most loyal customers and are always ready to try new products.
-
Loyal customers (medium R, high F, and medium M). They are active and sociable and often make moderate purchases. They love promotions and discounts and are always ready to come back for a good deal.
-
Big spenders (low R, high F, and high M). They are cautious and reliable, and they don't buy often but usually spend large amounts. They value quality and are willing to pay for it.
-
Perfectionists (medium R, medium F, and high M). They regularly make high-value purchases. They carefully select products and always return to their favorite brands.
-
Dreamers (low R, low F, and medium M). They rarely buy, but they spend little. They love comfort and usually choose what brings them pleasure.
Selecting the number of clusters using the elbow method
When configuring the algorithm, it is important to determine the optimal number of groups in order to prevent overly fine segmentation of customers with similar characteristics. Conversely, you want to avoid creating overly large groups with heterogeneous data. The ideal result is a graph showing maximum distance between groups and minimum distance within each group. This ensures a clear distinction between segments.
The elbow method helps determine the ideal number of groups for data analysis. This method shows how internal variation changes as the number of groups increases. It is important to determine the point at which the decrease in variation becomes insignificant.
Perform clustering and analyze the results
Once you have determined the number of groups, apply the K-means algorithm. This will divide the data into clusters and assign each customer to a group. By analyzing the groups, you can identify different types of customers and find ways to improve their experience.
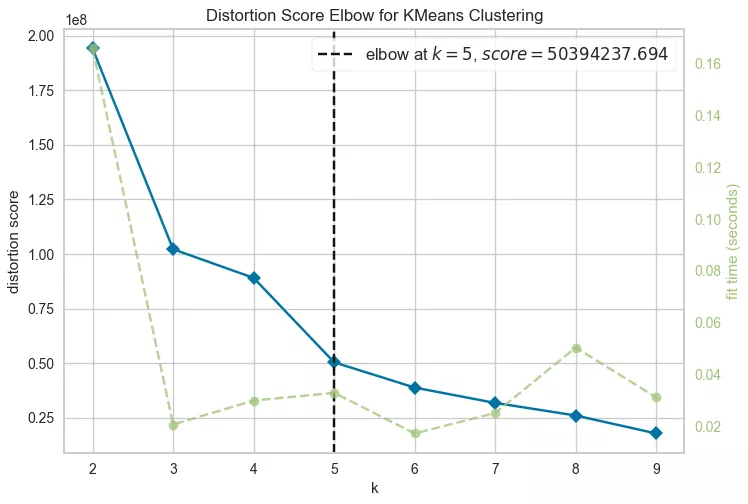
The algorithm determined that five clusters are optimal for your data.
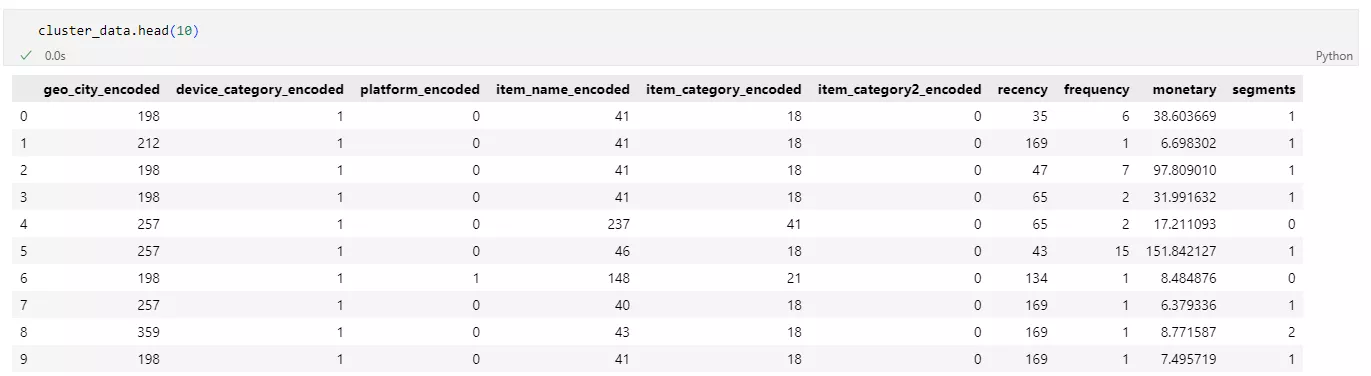
Output example
Each row of the source data contains specific values for coded categorical and numerical variables, and each row belongs to a specific cluster or segment.
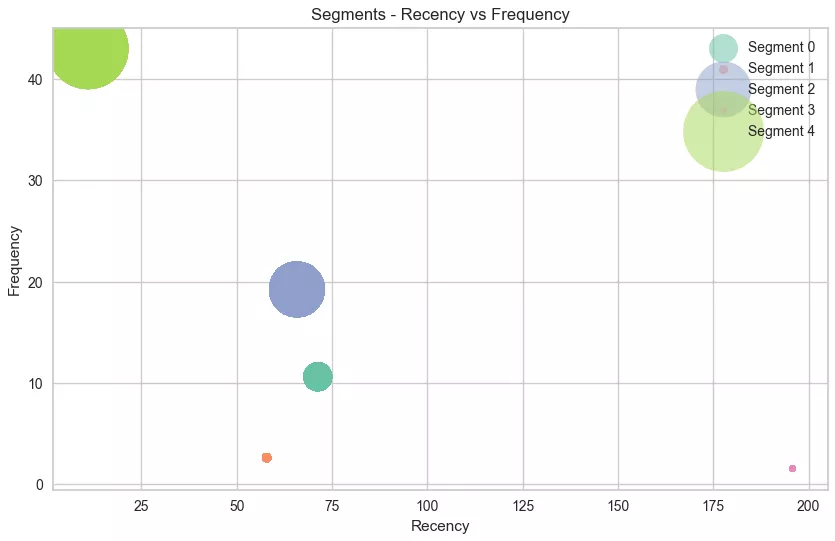
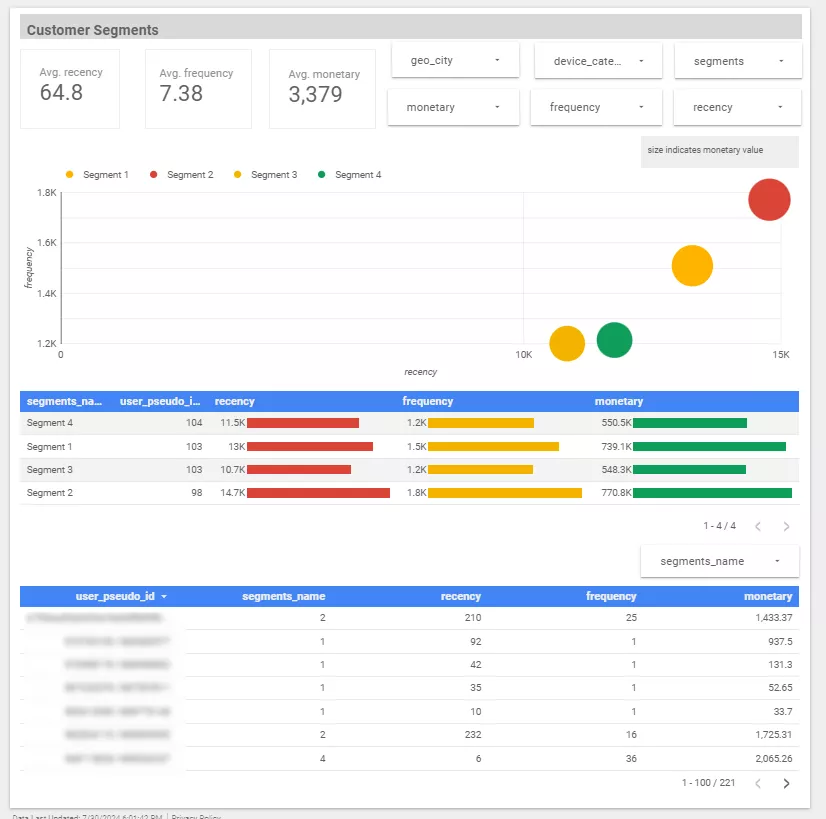
Visualization of clustering results
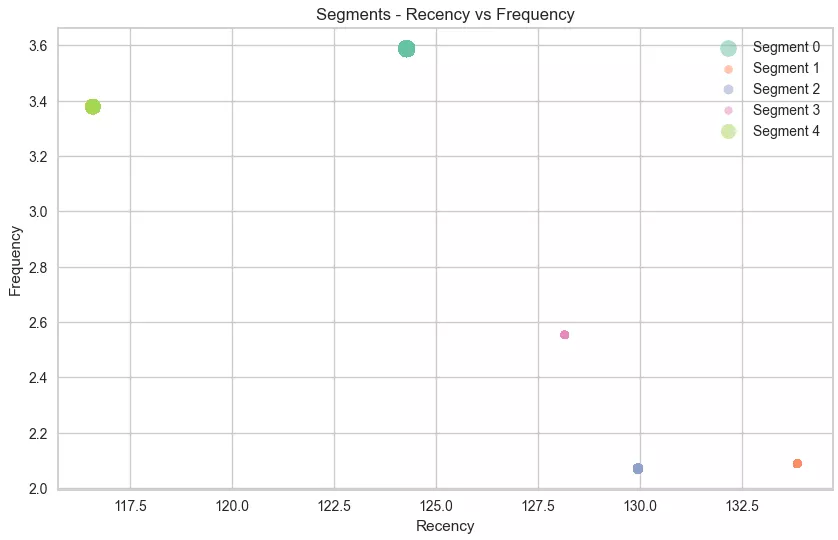
The clustering results show the characteristics of each segment based on three key metrics:
-
Recency: the user's latest activity.
-
Frequency: the frequency of purchases.
-
Monetary: the total amount spent, encoded in the segment diameter.
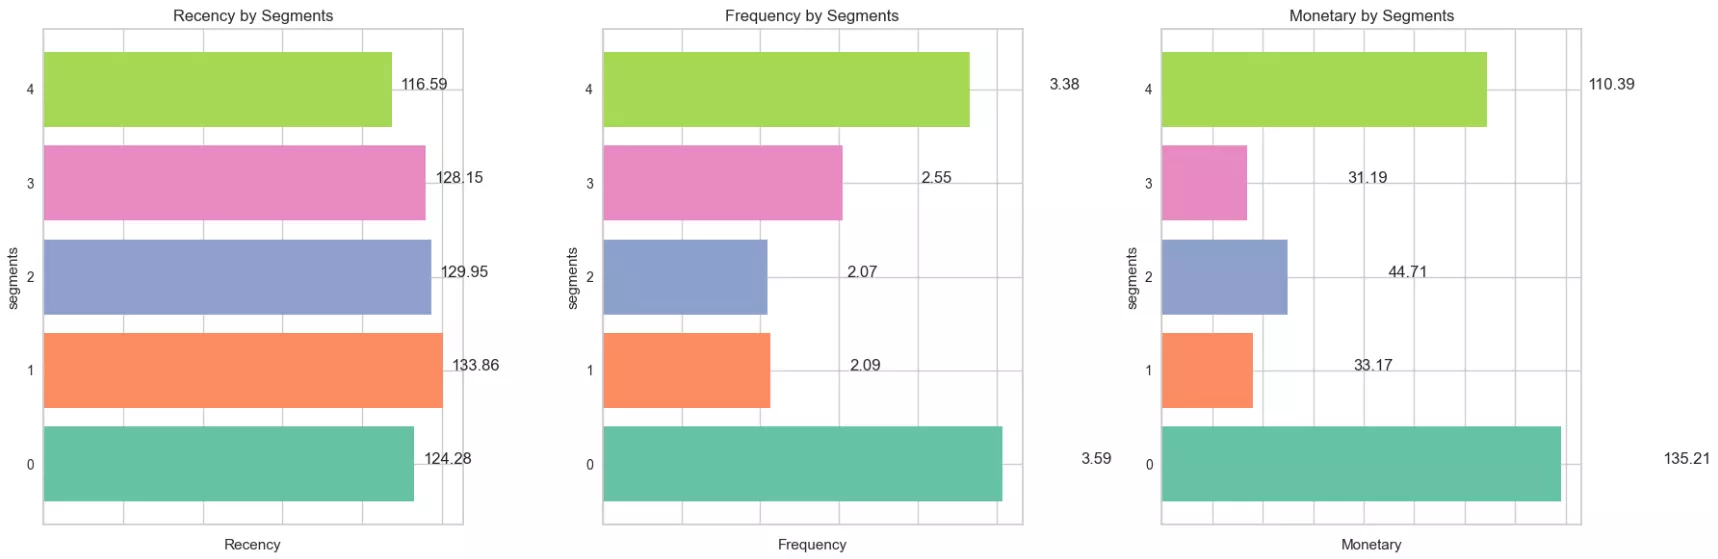
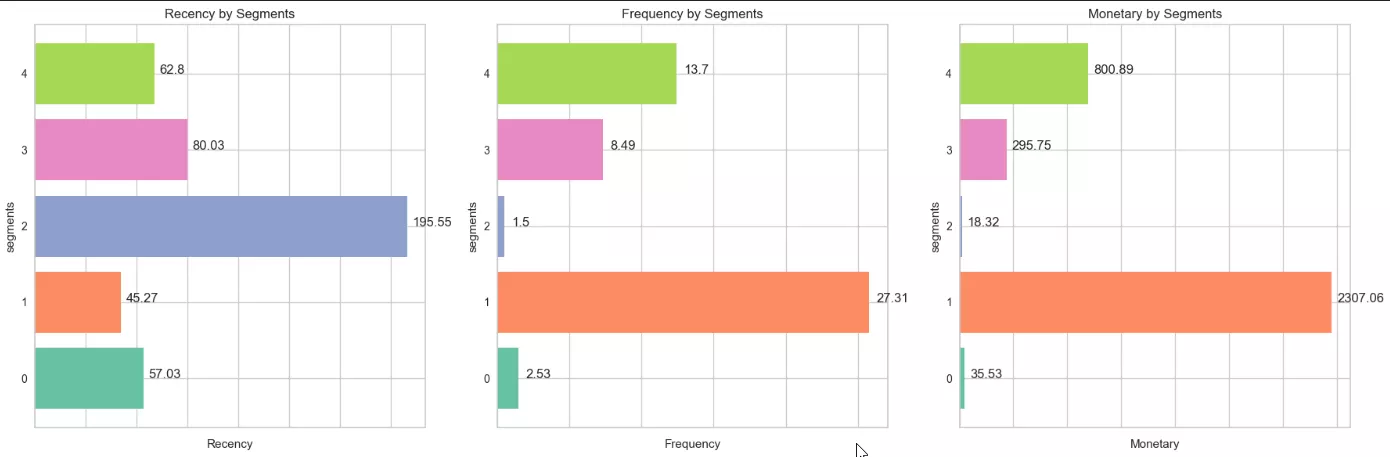
Now, let's analyze the obtained data.
Cluster 0: Moderately active customers (Medium R, High F, and High M).
Number of customers: 5,805.
These customers regularly make large purchases. They are loyal to the brand and often return for new purchases, so they are important to retain.
Cluster 1: Irregular customers (High R, Low F, and Low M).
Number of customers: 18,296.
These buyers have been purchasing infrequently for a long time, spending little money. They may lose interest, so they need to be actively engaged to return.
Cluster 2: Highly active customers (High R, Low F, and Medium M).
Number of customers: 3,514.
These customers placed their last order a long time ago and rarely make purchases, although they spend average amounts. They may be interested in making purchases but need an incentive to become more active.
Cluster 3: Inactive customers (High R, Medium F, and Low M).
Number of customers: 4,389.
These customers have been buying for a long time, but periodically and in small amounts.
Cluster 4: Top spenders (Medium R, High F, and High M).
Number of customers: 1,254.
They have been buying relatively recently, frequently, and in large amounts. As the most valuable customers, they should be supported and encouraged to make further purchases.
Clustering using PCA
Principal component analysis (PCA) is a statistical method that reduces data complexity while preserving essential information. It is particularly useful when there are many variables or interdependent features.
The main goal of PCA is to reduce the number of data measurements (i.e., factors or features) by transforming them into a smaller number of new variables (principal components).
How it works:
-
Identification of principal directions. PCA analyzes the data and identifies new directions (components) along which the variables exhibit the greatest variance. In other words, the new components can explain the largest portion of the variation in values.
-
Data projection. The data is then projected onto these new directions.
-
Dimensionality reduction. Rather than working with all the original variables, you can focus on a few main components that contain most of the information.
Advantages of PCA:
-
Dimensionality reduction. Reducing the number of measurements simplifies models and analyses, reduces noise, and improves the efficiency of machine learning algorithms.
-
Computational efficiency. Having fewer variables means fewer computational resources are required for analysis and visualization.
-
Structure detection. PCA helps identify underlying structures and patterns in data that are difficult to observe in high-dimensional spaces.
Analysis of PCA clustering results
PCA allows you to change the dimensions of your data.
Using the initial segmentation example, nine customer characteristics were converted into three indicators.
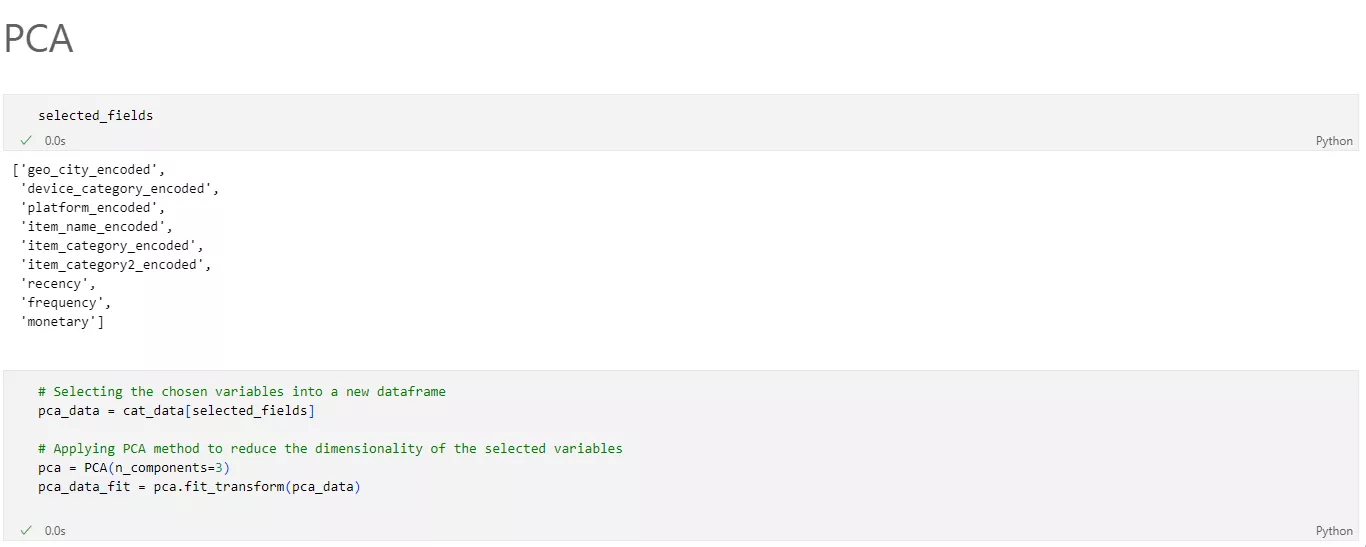
After reducing the data dimension using PCA, clustering was performed.
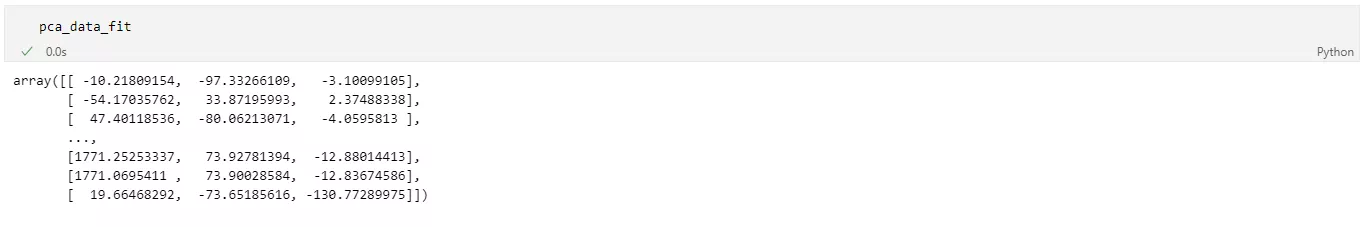
Example of data after applying PCA
Visually, this data is not useful. Additionally, manual processing is time-consuming. The K-means algorithm can quickly analyze and segment indicators.
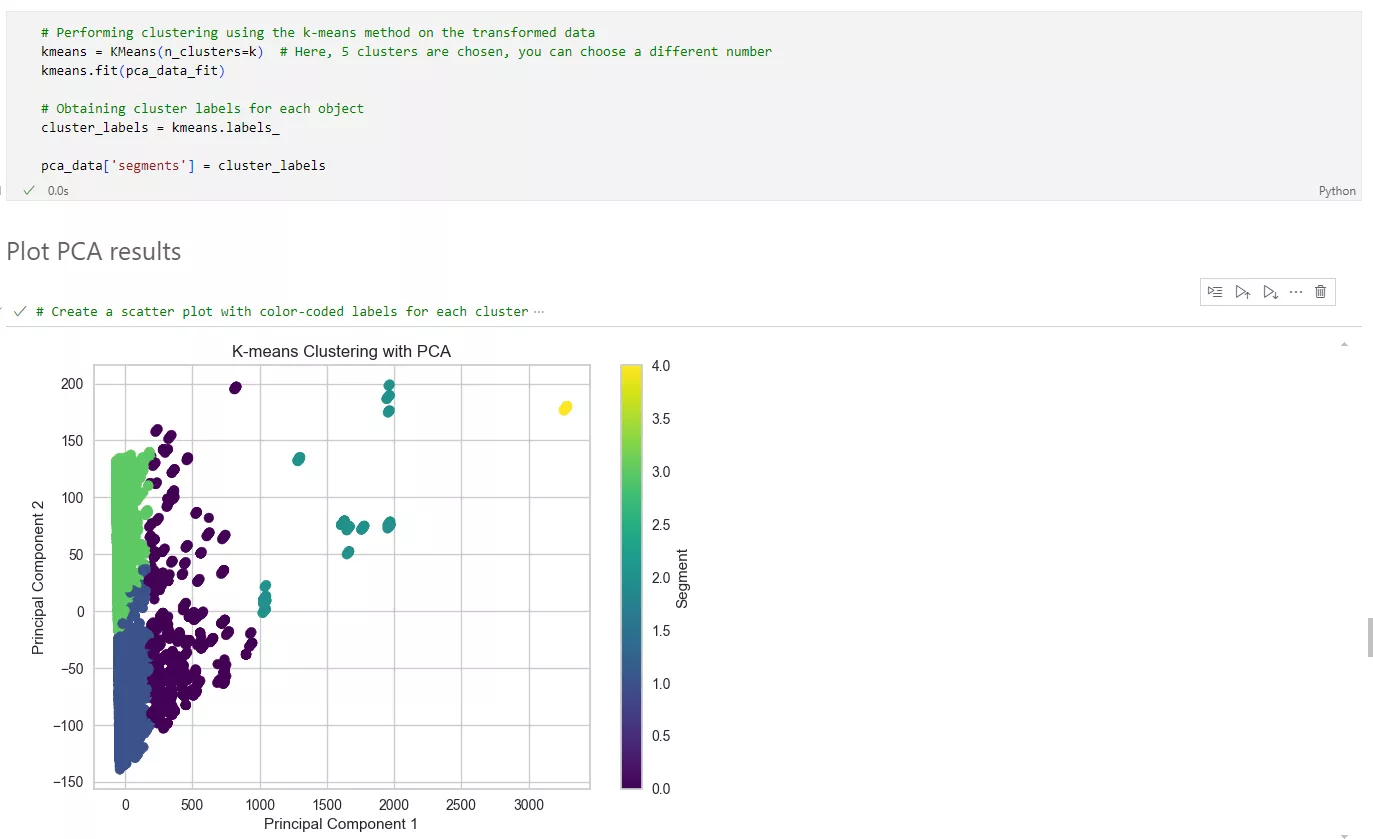
Example of data clustering after PCA
In the graph, each point represents a customer, and the color indicates their class. The segments can be separated from one another, meaning that users have unique characteristics.
Using the new cluster distribution, return to the RFM analysis metrics.
Cluster 0: Infrequent low spenders (Medium R, Low F, and Low M).
Number of customers: 14,010.
They make purchases with moderate regularity but spend little. They should be encouraged to make frequent, large purchases.
Cluster 1: High-Frequency Big Spenders (Low R, High F, and High M).
Number of customers: 144.
These customers buy often and spend a lot. They are valuable to the business and require special attention to maintain their loyalty.
Cluster 2: Dormant Low Spenders (High R, Low F, and Low M).
Number of customers: 17,373.
These customers haven't bought anything in a long time and rarely make purchases, spending very little. They need active engagement and incentives to return.
Cluster 3: Occasional Medium Spenders (Low R, Medium F, and Medium M).
Number of customers: 1,406.
They have made recent purchases, do so periodically, and spend average amounts.
Cluster 4: Moderately Frequent Medium Spenders (Medium R, Medium F, and Medium M).
Number of customers: 325.
These users buy with moderate regularity and have an average order value. They have the potential to increase their spending with the right motivation.
As you can see, using PCA significantly improved the quality of clustering by reducing the influence of correlations between metrics and identifying the main components carrying the greatest data variability. This made it possible to distribute users across segments more effectively.
The obtained data was saved for report generation.
Want to put RFM analysis into practice and get even more from your customer data?
Netpeak can build a full-fledged lead analytics system tailored to your business. We integrate data from Google Analytics 4, CRM, and advertising platforms into a single dashboard, so you can track every stage of the funnel — from the first click to a closed deal. Learn more about our lead analytics service →
Conclusions
An effective business is always customer-focused. Understanding customer needs, behavior, and preferences is essential for developing successful marketing strategies and improving service quality.
-
RFM analysis is a proven method for classifying users based on their purchase frequency, amount spent, and the time since their last transaction. This approach helps businesses focus on the most valuable audience segments.
-
However, RFM requires a high-quality dataset, which can be obtained from Google Analytics 4 (GA4). Integrating GA4 with Google BigQuery automates data collection for further processing.
-
Data preparation is a crucial step for obtaining accurate results. It involves handling missing data, normalizing values, removing outliers, and organizing indicators.
-
With tools like Python and libraries such as Pandas, Scikit-Learn, NumPy, Matplotlib, and Seaborn, you can automate data processing, build RFM models, and gain valuable insights.
-
RFM analysis allows you to:
-
Identify your most loyal customers
-
Develop personalized strategies
-
Optimize marketing expenses
-
Increase customer satisfaction
-
With RFM, you can segment your customers into groups such as champions, loyal customers, big spenders, perfectionists, dreamers, and more. Each group has unique needs and different possibilities for your business.
-
For deeper user segmentation, you can use the K-means method, which groups customers according to similar characteristics. This allows you to adapt your marketing strategies for each group.
To sum up, RFM analysis significantly improves business process efficiency by focusing on customer behavior.

 2
2
 2
2
 0
0
Recommended theme posts
Related Articles
Local SEO for Home Service Companies: 8 Fool-Proof Ways to Reach Your Customers
When something breaks, people go straight to Google to find a plumber, an electrician, or a roofer right away. And local home services SEO is what makes sure you’re the one they find (and choose!) instead of your competitor.
Local SEO for Construction Companies Explained
If clients can’t find you online, they hire someone else. Learn how local SEO puts your construction business in front of ready buyers.
How to Market a Security Company in 2026?
Most security companies are invisible online. Here's how to fix that and turn your digital presence into a steady stream of qualified leads.