Data Visualization Agency

Your marketing data lives in five different tabs, and the decision it should shape usually gets made before anyone finishes pulling it together? We know how to fix this analytics issue at scale.

Netpeak's dashboard development replaces that mess with automated, role-based dashboards, so you always know exactly where the money's landing.

GET MY FREE CONSULTATION

What Your Reporting Will Look Like

Every dashboard is built around your specific business goals as part of our data visualization services, so the data's easy to read and the calls come fast.

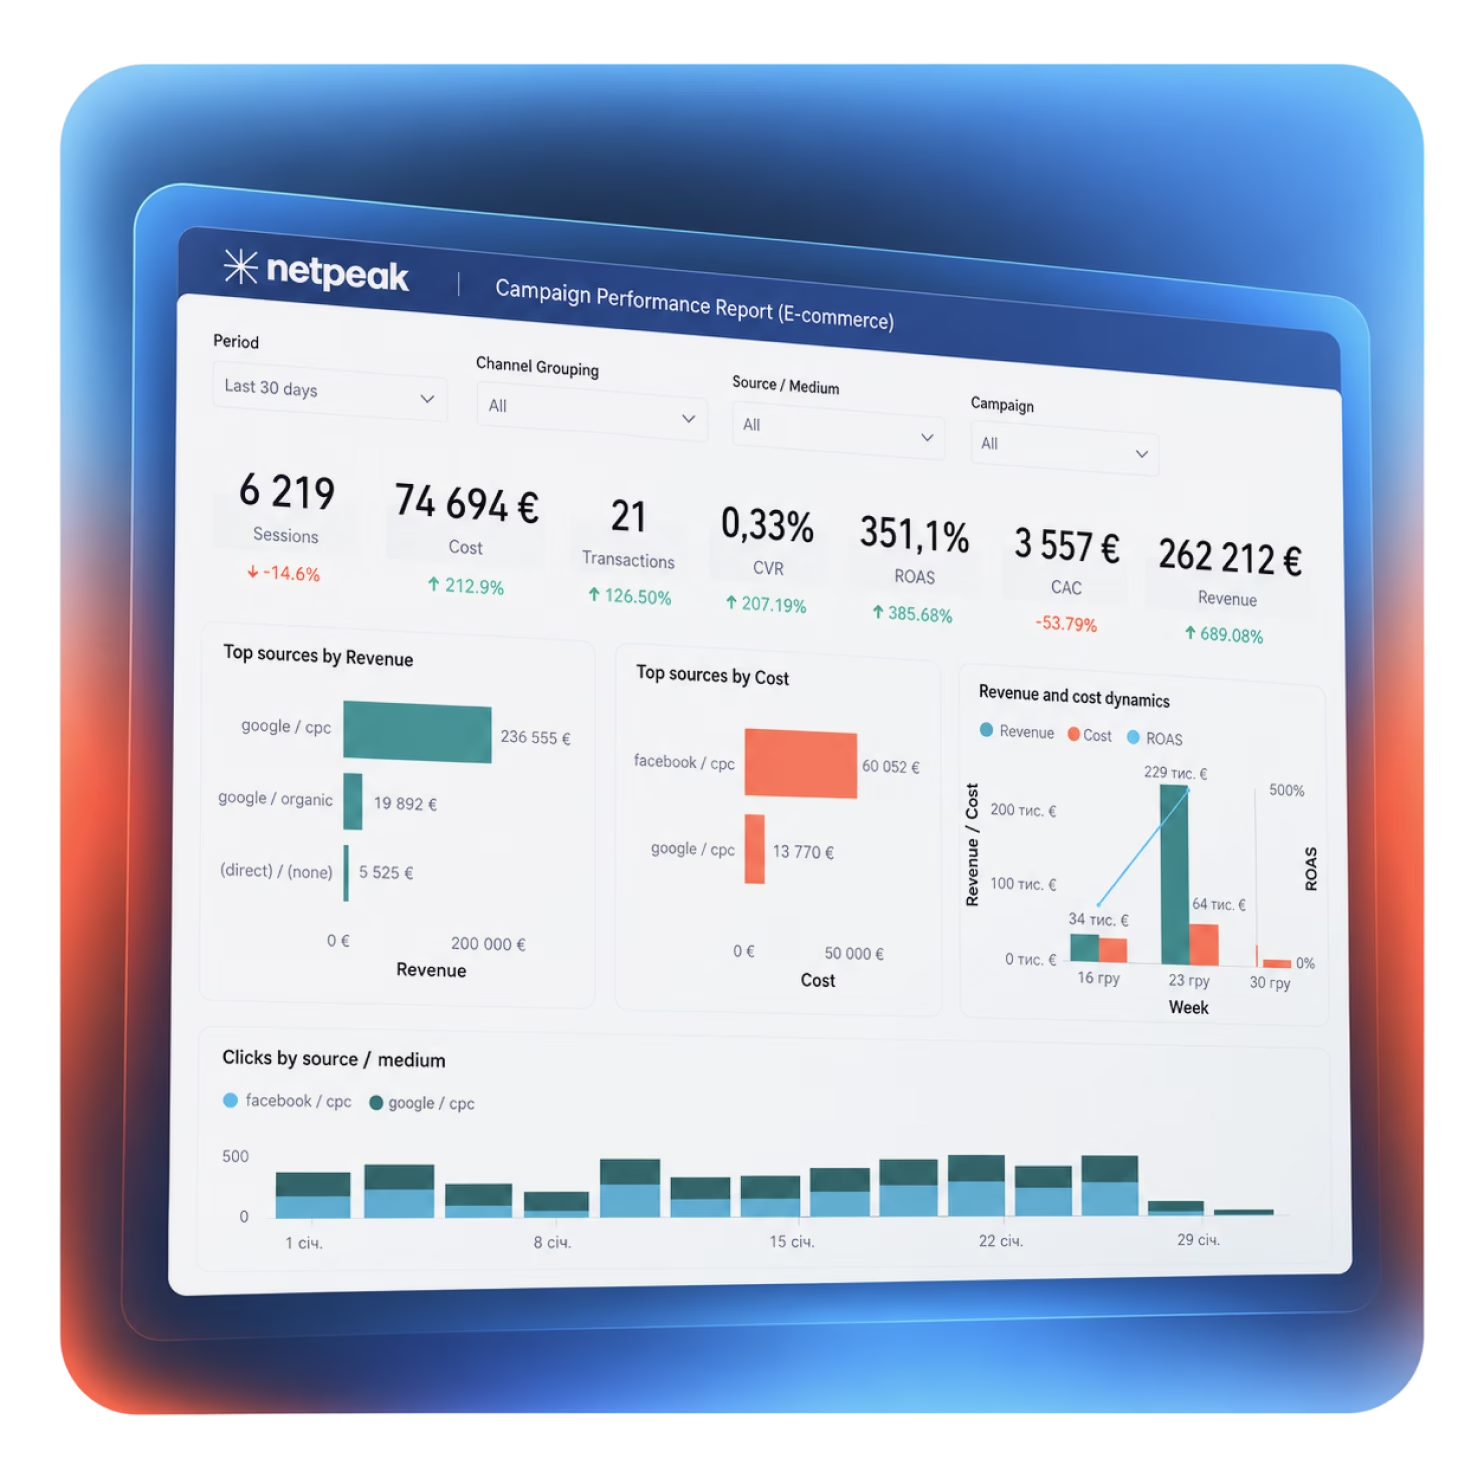
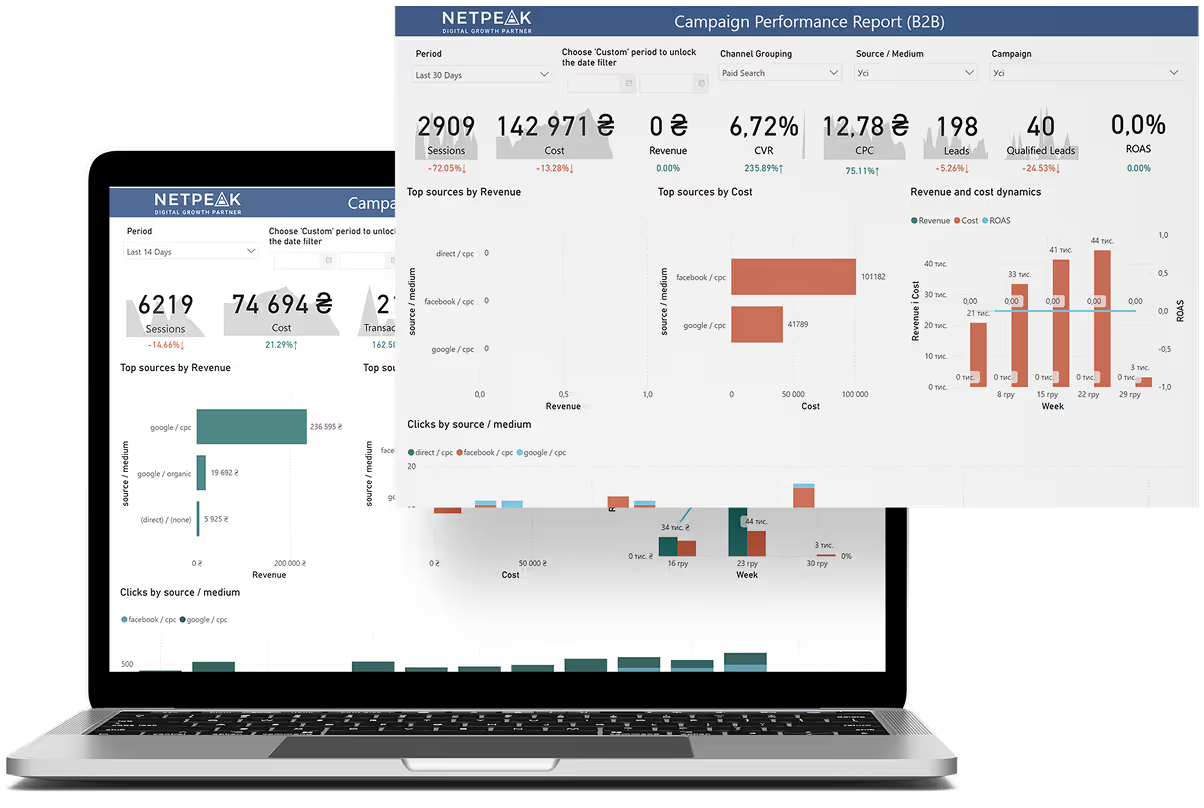
Campaign Report
Track spend and performance across every ad platform in one view.
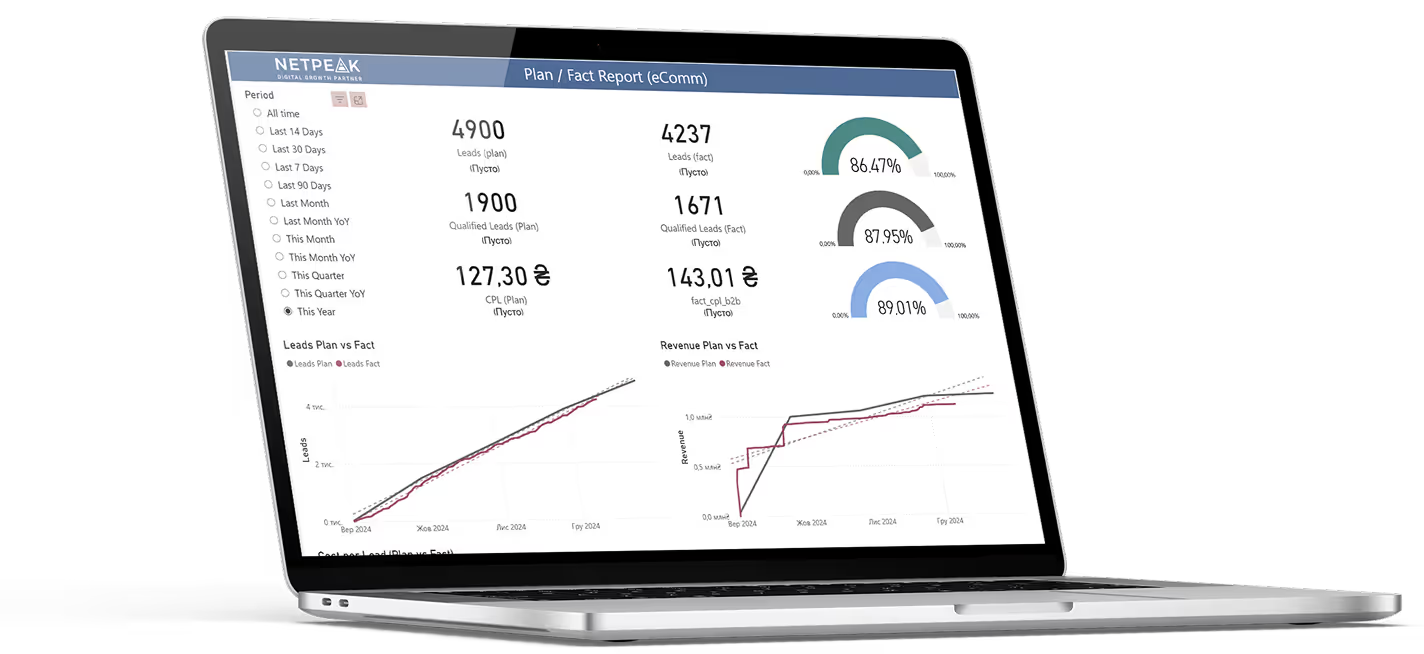
Plan vs. Actual Report
See real-time performance against targets, no monthly wait required.
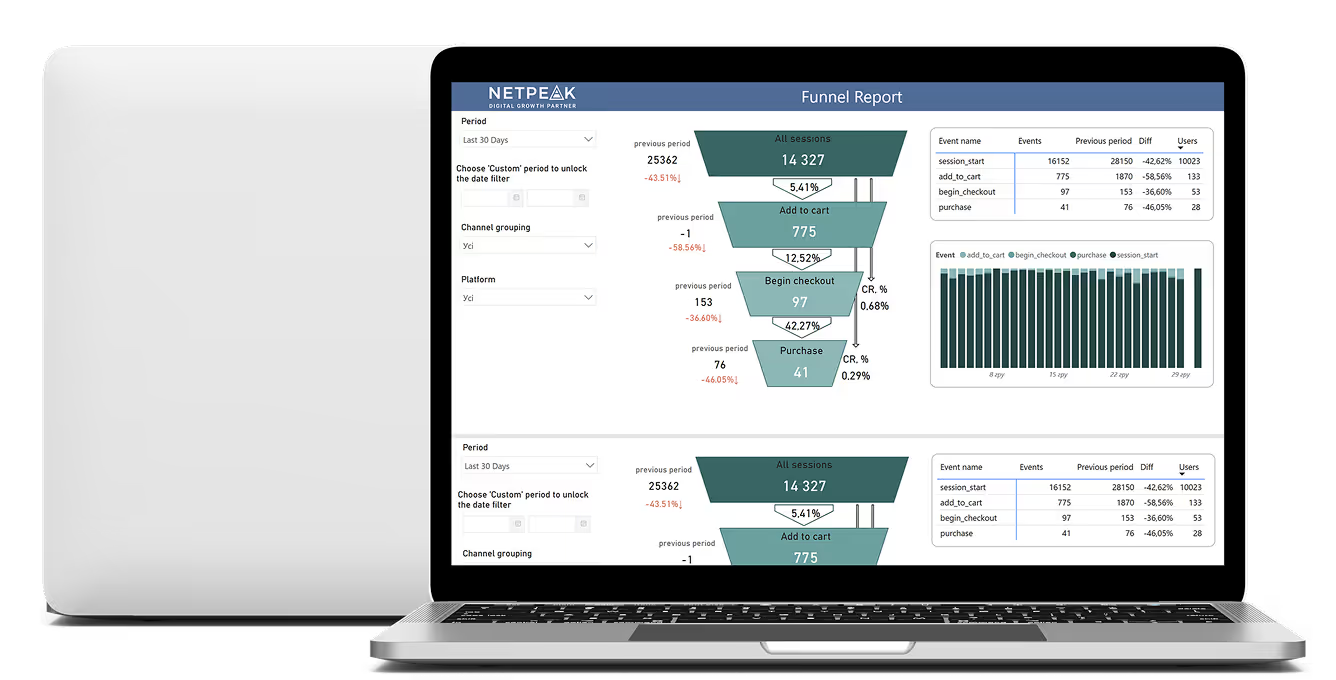
Funnel Report
Follow a customer from first click to converted sale.
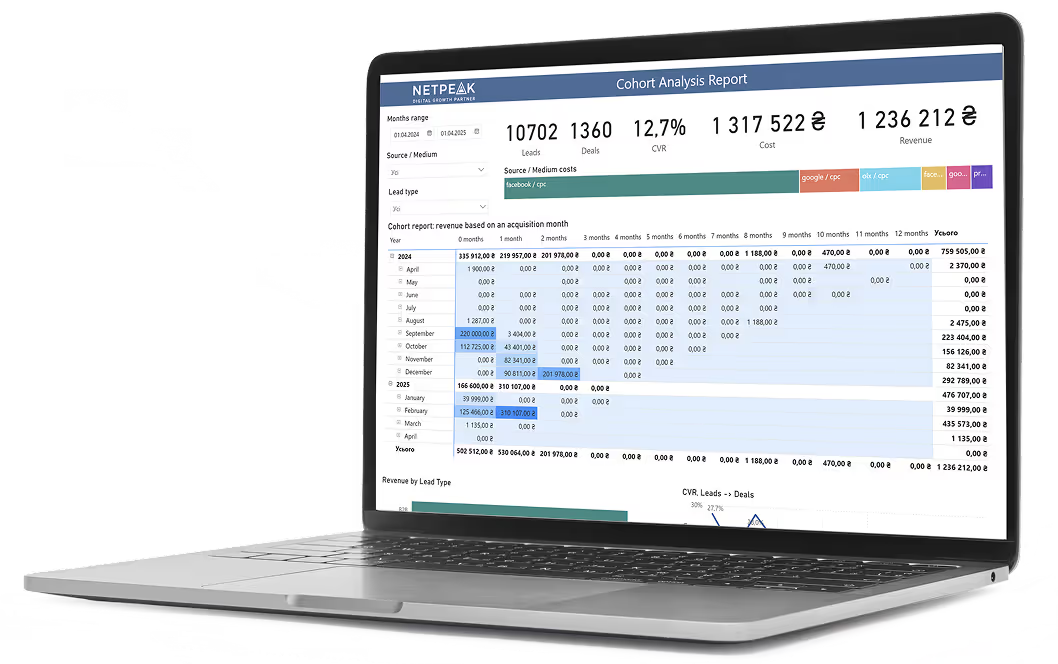
Cohort Report
Track how different customer groups behave over time.
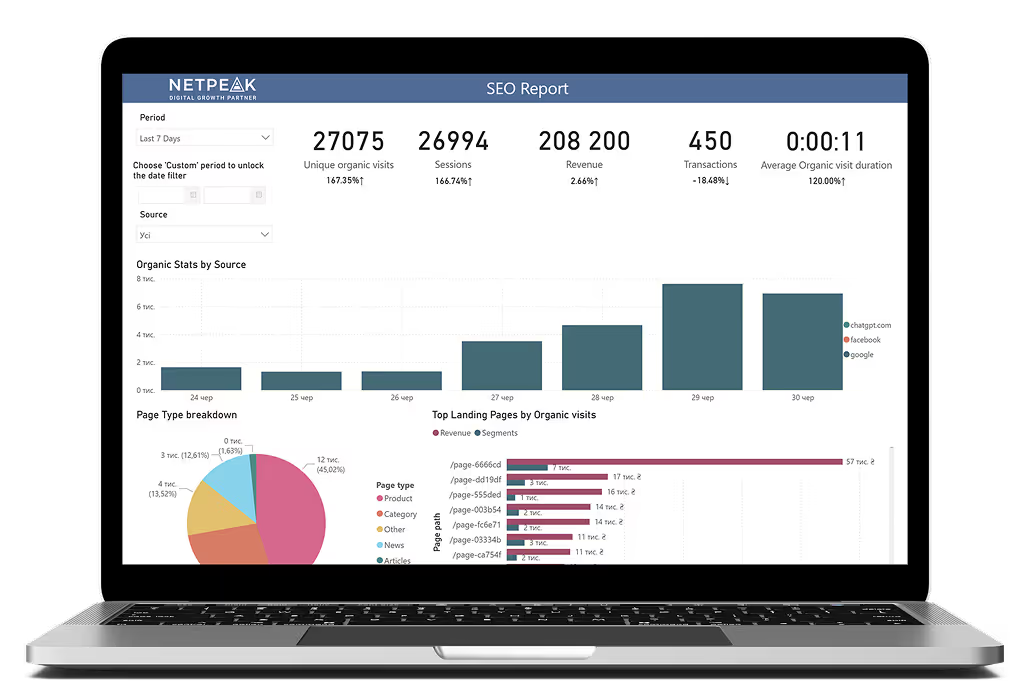
SEO Report
Connect rankings and organic traffic to leads and revenue.

Make Faster Decisions

We'll help you pull data from every platform into clear, organized dashboards.
Request a Demo

How Manual Reporting Is Costing You Time and Money

Manual reporting is less a small annoyance and more the biggest obstacle standing between your business and real data and analytics transformation. Fixing it means treating your reporting as a full life cycle, and not a weekly scramble.

Reports Built by Hand, Every Single Week

Someone pulls numbers from Ads, GA4 and your CRM into Excel by hand, and the report is already outdated by the time it's finished.

Ads, GA4, and In-House CRMs Seldom Agree

Ask three people what your marketing made last month and you'll get three different answers (none technically wrong and that’s the main issue).

Reporting Breaks the Moment You Grow

A dashboard that worked fine at a smaller scale starts failing once you start generating enough big data to cross a platform's limits, and nobody notices until a number looks obviously wrong.

Every New Market Starts Reporting From Zero

A new brand, market, or product means building an entire reporting setup from scratch, under deadline, with nothing to copy from.

What Problems Netpeak’s Dashboards Solve

Those manual reporting issues don't fix themselves. Here's where and how Netpeak's dashboards replace that mess.

Reports Built by Hand From Excel and Screenshots, With Data Scattered Across Platforms

What we do:
Pull data from Ads, GA4, CRM and offline sources into one BigQuery database.
Set up daily automatic refreshes and publish role-based reports in Power BI, so each team sees its own KPIs with nothing assembled by hand.
Result:
One screen for every decision, with hours of routine work removed every week.

Numbers That Don't Match Between Ads, GA4, and In-House CRM

What we do:
Marketing analytics and data quality management to reconcile attribution, time windows and deduplication across every source.
Eliminate double-counting so every platform reports off the same shared logic.
Result:
More accurate reporting.

Looker Studio or Excel Choking on Limits, Sampling, and Failed Refreshes

What we do:
Build reliable refreshes with automatic retries and alerts, and standardize how every team calculates KPIs like ROMI, CPA and LTV.
Move heavy calculations into BigQuery and eliminate sampling.
Result:
Fast, stable updates with no data trimmed, one shared methodology, and the same numbers for everyone.

Needing to Scale Fast Into New Brands, Markets, or Products

What we do:
Set a standard campaign and UTM naming convention.
Build templated, role-based dashboards in Power BI ready to copy onto any new unit or country.
Result:
One template, and a fast reporting start in any new market with no manual setup.

What's Included in Every Unified Dashboard

Data Sources

Analytics
Platforms:

  • Google Analytics;
  • Firebase;
  • AppsFlyer;
  • Adjust and more.

Ad
Accounts:

  • Google Ads;
  • Meta Ads;
  • TikTok Ads;
  • Telegram Ads;
  • Display&Video and more.

Databases:

  • MySQL;
  • GBQ;
  • Redshift.

CRM Systems:

  • Creatio;
  • OneBox;
  • NetHunt;
  • KeyCRM and more.

Visualization Tools

Why Choose Dashboard Development From Netpeak

As a data visualization company, here's what sets us apart.

Deep & Focused Expertise: We are experts in digital marketing and data analytics, and can handle anything from basic tracking setup to complex, multi-source BI builds.
Certified Partnerships: We're a certified partner across the full Google Marketing Platform, and the only marketing agency with Google Cloud Service Partner status.
Certified Specialists: Every Netpeak analyst holds Google Analytics and Google Tag Manager certifications, and our senior specialists are Google Cloud Professional certified, backing every business intelligence solution we build.
Full Technical Stack: SQL, Python, BigQuery, Power BI and Looker Studio are the tools we work in daily, and we push each one further with every project.
400+ analytics projects delivered
40+ companies served
GET MY FREE CONSULTATION

Data Visualization Expertise Across Every Industry

300+ projects in E-commerce

We combine sales, ad spend and customer behavior into one view, so you always know which products and channels are driving revenue.
Learn more

We help you optimize:

Conversion rate
Customer acquisition cost (CAC)
Average order value (AOV)
Return on ad spend (ROAS)

50+ projects in IT

We connect uptime, ticket volume and system performance into one dashboard, so your team catches a developing problem before it becomes an outage.
Learn more

We help you optimize:

Uptime
Ticket resolution time
System performance
Incident response time

100+ projects in Finance & Insurance

We build dashboards that track cash flow, spend and revenue across every account in real time, so finance teams stop waiting on a monthly close to see where the money went.
Learn more

We help you optimize:

ROI
Cash flow visibility
Budget variance
Reporting turnaround time

45+ projects in Healthcare

We connect patient volume, appointment data and billing into one dashboard, so your team sees where a funnel leak is costing appointments before it becomes a bigger problem.
Learn more

We help you optimize:

Patient acquisition cost
Appointment volume
Billing accuracy
Patient retention

How We Go From Disconnected Data to One Clean Dashboard

Those manual reporting issues don't fix themselves. Here's where and how Netpeak's dashboards replace that mess.

1. Define Goals and KPIs

Every project starts by pinning down exactly what you need to know, so your whole team is working off the same input data.

2. Collect and Model Your Data

Raw numbers get pulled through a clean data processing pipeline and structured around those goals, so the data design behind the final visualization shows what matters without distortion or overload.

3. Build One Unified Database

Every source feeds into a single data platform that becomes the foundation everything else is built on.

4. Launch Role-Based Dashboards

Once that's integrated into Power BI, each team gets a dashboard showing their own KPIs, with nothing assembled by hand.

5. Build In Reliability and Support

Security, uptime and ongoing support get built in from the start, so your reporting stays stable and the risks stay under control.

What Shapes & Affects The Dashboard Project Price

ASO gets you found in the store. GEO gets you recommended before users get there.

Template Solution

Our fastest way to get a working dashboard live, built from proven formats you don't have to design yourself.
What's included:
Choose from our library of pre-built dashboard templates.
Connect your core data sources (GA4, Google Ads, Meta Ads, CRM) to BigQuery.
Launch visualization in Power BI using proven report formats.
When to choose it:
You need a fast start with core KPIs and no complex customization.
Why it's worth it:
Short implementation timeline.
Built to scale later.
GET MY FREE CONSULTATION

Custom Solution

Our data visualization consulting service for businesses whose processes, data sources or metrics don't fit a template.
What's included:
A full audit of your existing analytics setup.
Tooling and infrastructure selection (Google Cloud, BigQuery, Power BI, Looker Studio or Tableau).
Every business data source connected to BigQuery, with custom visualization services built specifically for your business.
When to choose it:
Your processes are complex, your data sources are many, and you need role-based access or metrics unique to your business.
Why it's worth it:
Built around your exact workflows, so nothing gets flattened to fit a generic template.
Complex processes and integrations get handled from day one.

Our Dashboard & Analytics Case Studies

1:1 USER TRACKING
DAILY DATA UPDATES
RAW GA4 DATA
A handmade pet accessories brand came to us with listings nobody was finding. We overhauled listing SEO, expanded keywords from 27 to 522 unique tags, and restructured ads around high-converting products. Same store. Same products.
10X FASTER PROCESSING
DAILY DATA UPDATES
10 PARALLEL FLOWS
We connected this e-commerce brand's ad platforms and analytics into one system, turning scattered channel data into a clear view of where the budget was actually paying off.
4 MONTHS
CUSTOM EVENTS
GA4 REPORTS
We set up Google Analytics 4 from scratch for this non-profit education platform, building the tracking foundation a growing public project didn't have yet.
4 DATA SOURCES
85% LEADS MATCHED
$5/MONTH
We combined four separate data sources for this recruitment platform into one clear dashboard covering their entire hiring funnel.

Customer Reviews

"The Netpeak team's work on our strategy, creative direction and ad formats was genuinely dynamic. Our brand awareness grew 44%."
Olena Badovska
Marketing Director at EnglishDom

Popular on Our Blog

How to Use Calculated Fields in Looker Studio (Google Data Studio)
Learn more
How to Blend Data Sources in Google Looker Studio
Learn more
Automatic Analysis of Customer Data (RFM Analysis) Using Google BigQuery
Learn more
Cloud Marketing and AI Analytics: How Businesses Use Data to Optimize Advertising
Learn more
What Is a Service Account and How to Use It in Looker Studio?
Learn more
Importing Data into Google Analytics 4: A Complete Guide to End-to-End Analysis
Learn more

FAQ

Our average time-to-proposal is  3 days
Request now!
Get a free consultation
Thank you, we'll circle back to you in 2 business days.
Oops! Something went wrong while submitting the form.

Launch Your Project With Netpeak Today

Kateryna Holubka
Head of Sales of Netpeak International