
Don't Be Fooled by NORAM Beauty E-Commerce Growing 21% Last Year. 7% Is the New Norm
North American beauty e-commerce is forecast to grow at 6.8% a year through 2030 (Playbook of Beauty, 2026), and Grand View Research independently puts the online channel for US cosmetics at 7.1% CAGR to the same date. NielsenIQ measured North American online beauty sales up 21% year over year in its most recent State of Beauty report.
Those numbers are not in conflict, but the gap between them is the most important planning fact in beauty right now. If your 2027 budget extrapolates last year’s online growth curve, you are modelling roughly three times the revenue the forecasts support.
What the 2025 to 2030 Channel Forecast Shows
The chart below estimates compound annual growth in beauty sales by channel and region from 2025 to 2030. Playbook of Beauty built it from McKinsey’s June 2026 report, "From aisle to algorithm: The beauty categories, channels, and concepts shaping 2030 growth."
McKinsey projects the global beauty market growing about 5% a year to reach $590 billion by 2030. E-commerce already accounts for 28% of global beauty sales by channel, ahead of grocery at 19% and specialty beauty retail at 18% (McKinsey, 2026).
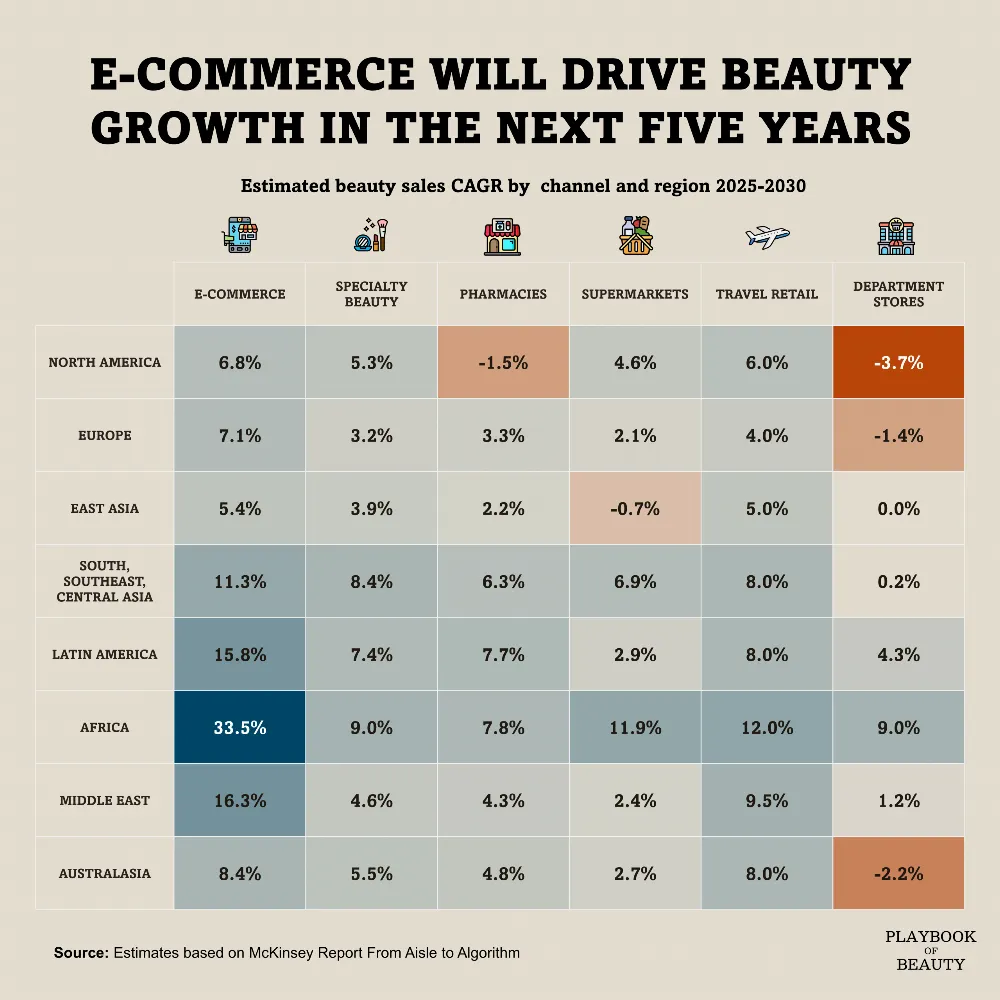
Estimated beauty sales CAGR by channel and region, 2025-2030. Chart: Playbook of Beauty, July 2026, based on McKinsey, "From aisle to algorithm."
E-commerce leads growth in every region without exception. Africa posts 33.5%, the single highest figure on the grid. The Middle East reaches 16.3%, Latin America 15.8%, and South, Southeast, and Central Asia 11.3%. Europe sits at 7.1% and North America at 6.8%, above only East Asia at 5.4% (McKinsey, 2026).
Five cells go negative. Department stores contract 3.7% a year in North America, 2.2% in Australasia and 1.4% in Europe. North American pharmacies decline 1.5% and East Asian supermarkets 0.7%. Every other channel and region combination grows.
Why Last Year’s 21% Will Not Repeat
NielsenIQ reported global beauty sales up 10% year over year, with online sales growing nine times faster than in-store. North America was up 21%, Asia Pacific 20% and Europe 10% (NielsenIQ, State of Beauty 2025). Those are measured results over 12 months, not forecasts.
The 6.8% figure is a five-year compound rate. Comparing the two directly is unfair, and comparing them carefully is instructive. A market cannot compound at 21% for five years once penetration is already high, because the shoppers who would switch online have mostly switched. The 21% was a feu de paille: a real, bright, measurable burst that burns out precisely because it worked.
What makes the forecast credible is that it does not stand alone. Grand View Research puts the online distribution channel for US cosmetics at 7.1% CAGR from 2024 to 2030 (Grand View Research, 2024). Two independent houses, two different methodologies, one answer in the same narrow band.
The Planning Number: Model North American online beauty growth at 6.8% to 7.1% a year through 2030, not at last year’s measured 21%. If your board deck uses the higher figure, it is forecasting a recovery burst as if it were a trend.
Africa’s 33.5% Is the Least Useful Number on the Chart
It is also the number every deck will screenshot. Growth rates scale inversely to market maturity, and Africa starts from a beauty e-commerce base a small fraction of North America’s. Tripling a small number produces less revenue than adding 7% to a very large one.
This cuts both ways, and CMOs new to marketplace planning tend to get it wrong in one of two directions. Some chase emerging-market percentages into markets where the absolute prize stays small for a decade. Others read a single-digit domestic figure as decline and cut budget in the exact channel still generating the most incremental dollars.
The accurate read is that North America has stopped being a penetration market and become a share market.
Nobody in the United States is waiting to discover that serum can be bought online. Every point of growth now comes out of a competitor’s account rather than from new online shoppers entering the category.
That is a different job. Penetration markets reward showing up. Share markets reward product detail page quality, review velocity, replenishment retention and advertising efficiency. None of it photographs well. All of it compounds.
The Two Channels Losing Money, and What They Have in Common
Department stores are the clearest signal on the forecast. They lose 3.7% a year in North America while every other beauty channel there grows. Pharmacies decline 1.5% in the same market.
Both channels sold the same thing beyond product: assisted discovery. A counter associate, a curated assortment, a recommendation you could not get anywhere else. That service justified a markup. It no longer does, because discovery has moved to search results, review sections, social feeds and now AI shopping assistants. McKinsey notes social commerce growing faster than any other channel, with TikTok beauty sales on track for roughly $4 billion in 2026 (McKinsey, 2026).
Specialty beauty retail holds at 5.3% in North America, positive but below e-commerce. It survives where the experience is genuinely hard to replicate: sampling, diagnostics, treatment services, staff who know the difference between two similar actives. The parts of specialty retail that function as pure distribution carry the same structural risk department stores already realised.
If a physical account in your mix contributes nothing but shelf presence, the forecast has already told you what to model. Flat to declining, and no amount of relationship history changes the arithmetic.
Wanna be up to date with the latest beauty business updates? Check our other articles:
Beauty E-commerce Growth by Region, 2025 to 2030
The weakest channel column identifies the lowest forecast growth rate in each region, which is the account type most exposed in that market.
|
Region |
E-commerce CAGR |
Weakest channel |
Market type |
|
Africa |
33.5% |
Pharmacies, 7.8% |
Penetration |
|
Middle East |
16.3% |
Department stores, 1.2% |
Penetration |
|
Latin America |
15.8% |
Supermarkets, 2.9% |
Penetration |
|
South, SE, Central Asia |
11.3% |
Department stores, 0.2% |
Penetration |
|
Australasia |
8.4% |
Department stores, -2.2% |
Transitional |
|
Europe |
7.1% |
Department stores, -1.4% |
Share |
|
North America |
6.8% |
Department stores, -3.7% |
Share |
|
East Asia |
5.4% |
Supermarkets, -0.7% |
Share |
CAGR figures: Playbook of Beauty estimates based on McKinsey, "From aisle to algorithm," 2026. Market type classification: Netpeak US analysis
Five Moves Before the 2027 Planning Cycle
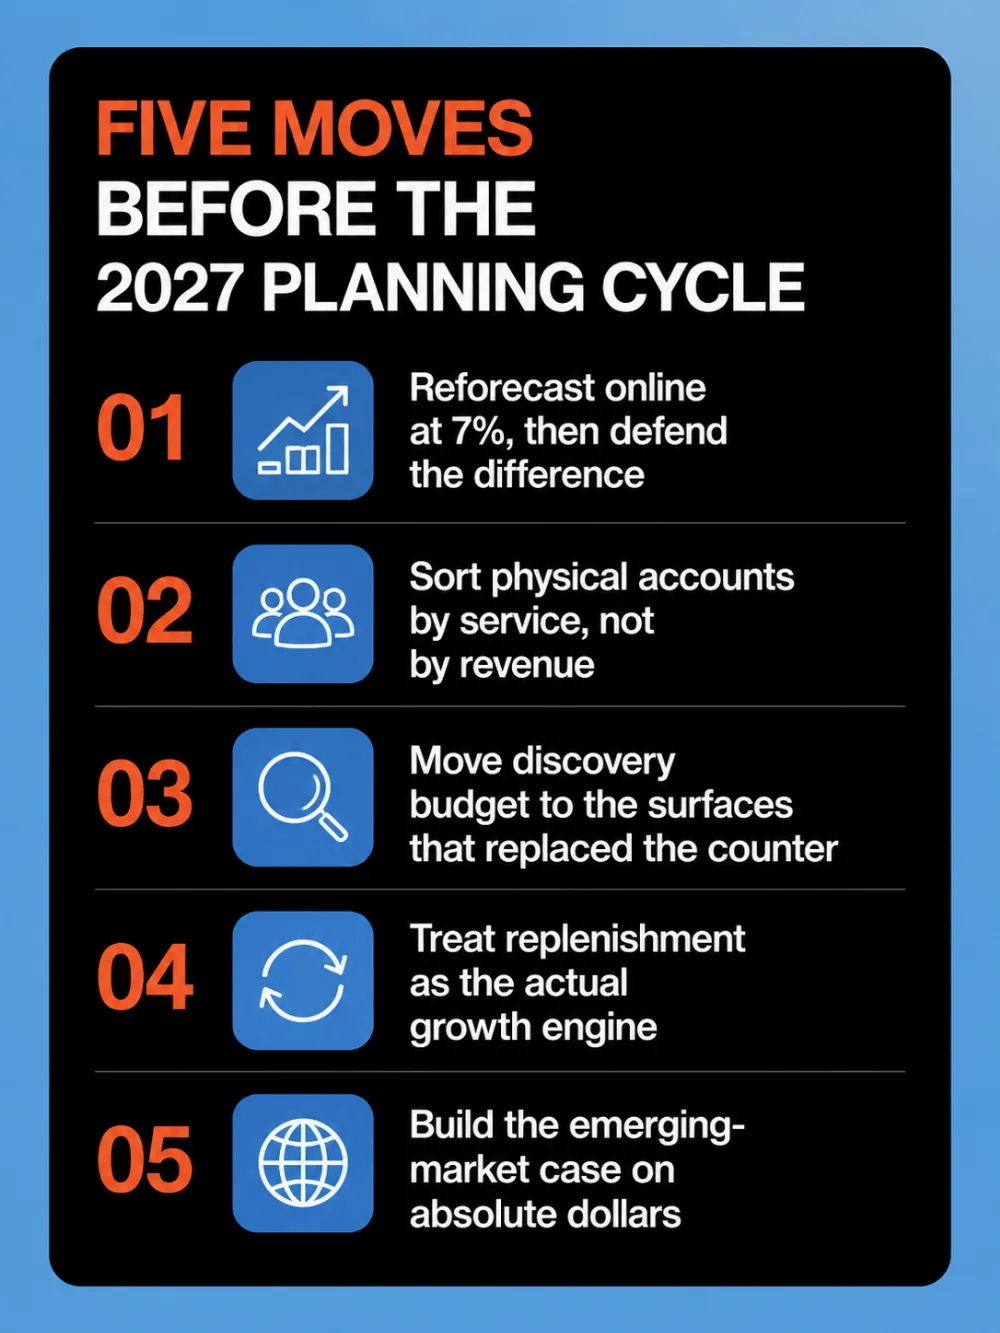
1. Reforecast online at 7%, then defend the difference
Rebuild the online line at 6.8% to 7.1% and see what breaks. Whatever gap opens between that number and your target is the amount of growth you have to win from competitors rather than from the channel. Name it explicitly in the plan.
Watchout: strip promotional spikes and one-off retail media tests out of the baseline. They inflate the trend and vanish the following year.
2. Sort physical accounts by service, not by revenue
Put every brick-and-mortar partner into one of two buckets. Bucket one earns its margin through sampling, diagnostics, treatment, or expertise. Bucket two moves units. Bucket two is your department store exposure, whatever the fascia above the door says.
Watchout: sales teams defend legacy accounts on relationship grounds. Ask for a sell-through by door instead of a sell-in.
3. Move discovery budget to the surfaces that replaced the counter
If shoppers no longer discover products at a counter, discovery spend belongs where discovery happens now: marketplace search, sponsored placements, retail media, creator content and AI shopping assistants. Your product detail page is doing the work a trained associate used to do, with none of the eye contact.
Watchout: do not cut in-store and raise online spend in the same quarter. Attribution will credit the wrong channel, and you will draw the wrong lesson from a real result.
4. Treat replenishment as the actual growth engine
Share markets reward retention over acquisition on cost every time. Subscription, autoship and replenishment reminders turn a single conversion into a multi-year annuity. Beauty has the advantage of predictable consumption cycles in skincare and haircare, where the bottle empties on schedule whether or not anyone is paying attention.
Watchout: strong subscription rates can mask weak first-purchase conversion. Track new-to-brand and repeat separately, or you will optimize the wrong end of the funnel.
5. Build the emerging-market case on absolute dollars
Africa, the Middle East and Latin America are genuine opportunities, and the case for entering them is not the CAGR. Model absolute contribution in 2030 net of localisation, logistics and compliance costs. If the number still works, go. If it only works as a percentage, it does not work.
Watchout: high-growth markets carry payment, returns and counterfeit exposure that mature-market P&L templates do not capture.
Limits of This Data
Three caveats belong on the record. The heatmap is Playbook of Beauty’s estimate based on a McKinsey report, not McKinsey’s own published table, so treat the cells as directionally sound rather than precise to the decimal. NielsenIQ’s 21% and the 6.8% forecast measure different things across different periods, and the comparison here is deliberate rather than like for like.
And any five-year CAGR assumes no structural shock. Tariff changes, platform policy shifts and ingredient regulation can all move a channel faster than a smoothed average implies.
None of that changes the direction of travel. It changes only how much weight any single cell can carry.
Bonne chance — and may your Subscribe & Save conversion rate be ever in your favor!
Frequently Asked Questions
How fast is beauty e-commerce forecast to grow through 2030?
Beauty e-commerce is forecast to grow at 6.8% CAGR in North America and 7.1% in Europe from 2025 to 2030, with far higher rates in emerging regions: 33.5% in Africa, 16.3% in the Middle East and 15.8% in Latin America (McKinsey, 2026).
Grand View Research separately forecasts the online distribution channel for US cosmetics at 7.1% CAGR from 2024 to 2030.
Why did North American online beauty sales grow 21% but the forecast says under 7%?
The two figures measure different things. NielsenIQ reported 21% year-over-year growth in North American online beauty sales in its State of Beauty 2025 report, a single-period measured result. The 6.8% figure is a five-year compound annual forecast to 2030 (McKinsey, 2026).
Compound rates fall as channel penetration rises, so a mature market cannot sustain 21% annually across five years.
Which beauty retail channels are forecast to decline by 2030?
Department stores are forecast to contract 3.7% annually in North America, 2.2% in Australasia and 1.4% in Europe. North American pharmacies are forecast to decline 1.5% annually and East Asian supermarkets 0.7% (McKinsey, 2026). All other measured channel and region combinations show positive growth.
Which region has the fastest beauty e-commerce growth?
Africa, at a forecast 33.5% CAGR from 2025 to 2030, the highest figure of any channel in any region on the forecast. The Middle East follows at 16.3% and Latin America at 15.8% (McKinsey, 2026). These rates apply to comparatively small revenue bases, so absolute dollar growth remains concentrated in mature markets.
What share of global beauty sales is e-commerce today?
E-commerce accounts for 28% of global beauty sales by channel, ahead of grocery at 19% and specialty beauty retail stores at 18%. McKinsey projects the global beauty market growing about 5% a year to reach $590 billion by 2030 (McKinsey, 2026).
How much faster is online beauty growing than in-store?
NielsenIQ reported that online beauty sales grew nine times faster than in-store sales, with North America up 21%, Asia Pacific up 20% and Europe up 10%, against total global beauty sales growth of 10% year over year (NielsenIQ, State of Beauty 2025).
What should a beauty brand prioritise if online growth slows to 7%?
Shift planning from channel expansion to share capture. In a mature online market, incremental revenue comes from competitors rather than from new online shoppers, which makes product detail page quality, review velocity, replenishment retention and advertising efficiency the primary levers.
Brands should also reforecast legacy physical accounts, particularly department stores, at flat to declining contribution.

 0
0
 0
0
 0
0
 0
0
Related Articles
What Happens When Amazon Suppresses Your Listing? The New 2026 Rules
Under the new 2026 rules, Amazon warns you first and gives you a grace period to fix the issue.
Amazon’s New “Sourced from Brand” Buy Box Label: Who Gets It and Who Doesn’t
Amazon is rolling out a provenance line in the Buy Box. A short label under the Brand row now reads “Sourced from [Brand]” on amazon.com and “[Brand] approved” on amazon.de. It tells the shopper that the unit on offer came through the brand’s own supply c
How UGC and Algorithms Turn Content Into Viral Trends
Let’s break down how UGC, audience behavior, and recommendation algorithms work together to make something go viral. And how you can use this information to help your business grow.