
Moving companies that track their numbers typically see returns anywhere from about 5:1 to 19:1, depending on the channel and how you calculate it. Results we get show that digital marketing for movers can be really profitable.
Marketing ROI Benchmarks for Movers
|
Short Answer |
|
|
Average ROI |
Roughly 5:1 to 19:1 for paid, per-lead channels |
|
Best-performing channel |
Local Service Ads (~19:1, calculated below) and referrals (close ~2x better than average, though not a dollar ratio) |
|
Fastest ROI |
Google Local Services Ads and Google Ads |
|
Long-term ROI |
SEO + review generation, which compound over time |
|
Typical CAC (cost per lead) |
$30–$80 for paid search; $5–$20 for SEO; $10–$100+ for lead providers; $0–$15 for referrals (Netpeak US) |
|
Revenue per booked move |
~$2,300 for a local 2–3 bedroom move; ~$4,300 for a move over 1,000 miles (American Moving & Storage Association, via Allied) |
|
Time to positive ROI |
2–6 months for paid channels; 6–12 months for SEO and content |
How Is Marketing ROI Calculated?
Most "marketing ROI" statistics you'll find online are averaged across every industry — not moving companies specifically. Before showing the channel-by-channel numbers, here's how we adjusted them.
The question ROI answers: for every $1 you spend on a channel, how many $ do you get back?
The three numbers we need to answer it:
-
Cost per lead — what one lead costs on that channel
-
Close rate — out of 100 leads, how many actually become paying customers
-
Revenue per move — how much a booked customer pays you
The formula: (Close rate × Revenue per move) ÷ Cost per lead = ROI
The two numbers we held constant across every channel, so the comparison is fair:
-
Revenue per move: $2,300. This is the average price of a local 2–3 bedroom move, according to the moving industry's own trade group (American Moving & Storage Association, via Allied).
-
Close rate: 25%. Meaning 1 out of every 4 leads becomes a booked job (Netpeak US). The real industry range runs 20–30% typically, and up to 39% for companies with fast, disciplined follow-up (SmartMoving, 2026 Sales Benchmarks).
Limitations: This formula only works for channels where you pay per lead — Google Ads, Local Service Ads, and Facebook/Meta Ads. For SEO, email, reviews, referrals, and content marketing, there's no clean "cost per lead" to divide by.
Keep in mind that ROI shows revenue, not profit. 19:1 means "$19 of revenue comes in for every $1 spent on ads." It says nothing about what it costs you to actually run the move — the crew's wages, the truck, fuel, insurance, dispatch.
So "19:1 marketing ROI" and "19x profit" are very different claims, and the article is measuring the first one.
Average Marketing ROI Benchmarks by Channel (2026)
|
General Benchmark (all industries) |
Adapted for Movers |
|
|
~2:1 (Google, via WebFX) |
~7:1–19:1 |
|
|
Local Service Ads |
~7.8:1 on a $1,826 avg job (PipelineOn) |
~19:1 |
|
Facebook/Meta Ads |
~2.79:1 (WebFX) |
~5:1–15:1 |
|
~7.5:1 / 748% median (First Page Sage) |
~7.5:1, unchanged |
|
|
Email Marketing |
~36:1 (Litmus) |
~4:1–6:1, lowered |
|
Organic Reviews |
Not a ratio — 93% read reviews before choosing a business (BrightLocal) |
Not a ratio |
|
Referral Programs |
Not a ratio — 88% trust referrals over any ad (Nielsen) |
Not a ratio — closes ~2x better than average |
|
Content Marketing |
3x more leads, 62% cheaper than outbound (HubSpot, citing Demand Metric) |
Unchanged |
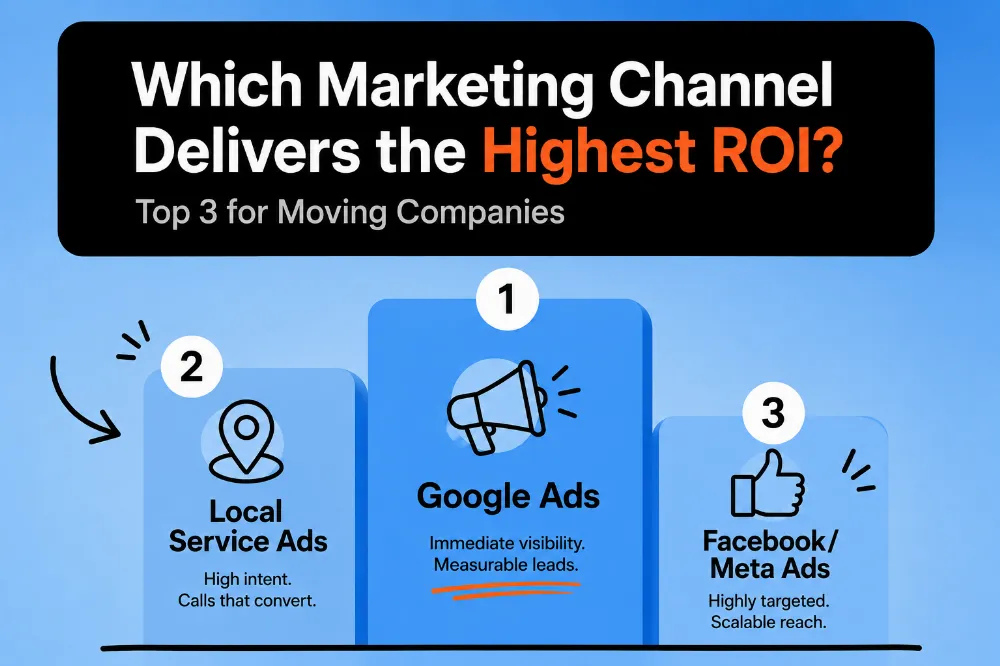
Which Marketing Channel Delivers the Highest ROI?
Here are numbers that you could use for your moving digital marketing.
Google Ads
Best for: Movers needing leads immediately, especially during peak season
Expected ROI: 7:1 to 19:1
Average timeline: Results within days, profitability within 1–2 months
Here's the math:
-
General benchmark: ~2:1 — Google's own published estimate, averaged across every advertising platform, including businesses selling $20 products (WebFX, citing Google)
-
Cost per lead for movers: $30–$80 (Netpeak US)
25% of $2,300 is $575 — that's what one average lead is worth. Divide that by the cost per lead. At a $30 CPL, $575 ÷ $30 = 19:1. At an $80 CPL, $575 ÷ $80 = 7:1.
So the adapted range is 7:1 to 19:1, well above Google's own general 2:1 average, because a $2,300 moving job is worth far more than what most businesses in that average are selling.
Local Service Ads
Best for: Companies wanting pay-per-lead pricing instead of pay-per-click
Expected ROI: 4:1–6:1
Average timeline: 2–4 weeks
Here's the math:
-
General benchmark: A study of 888 home-service contractors found a $53 average cost per lead, a 43.9% lead-to-booking rate, and a 7.84:1 closed ROAS, based on a $1,826 average job across all the trades in that study (PipelineOn)
Using that same $53 cost and 43.9% close rate, but swapping in movers' higher $2,300 average job: 43.9% of $2,300 is $1,010. Divide by $53: $1,010 ÷ $53 = 19:1.
The adapted number is higher than the general 7.84:1 simply because moving pays more per job than the average trade in that study — the underlying budget and close rate didn't change, only the job value.
Facebook/Meta Ads
Best for: Brand awareness and off-season lead generation
Expected ROI: 5:1 to 15:1
Average timeline: 1–2 months, though direct-response performance is weaker than search
Here's the math:
-
General benchmark: ~2.79:1 average return on ad spend across mostly e-commerce advertisers (WebFX, Meta Benchmarks 2026)
-
Cost per lead for movers: $15–$45 (Netpeak US)
Be careful with this one: nobody publishes a moving-specific close rate for Facebook leads. We estimated 10% (lower than the 25% we used for Google Ads, because someone scrolling Facebook isn't actively searching "movers near me" the way a Google searcher is). That 10% is our assumption, not a fact from a study. With it: 10% of $2,300 is $230. At a $15 CPL, $230 ÷ $15 = 15:1.
At a $45 CPL, $230 ÷ $45 = 5:1. So the adapted range is 5:1 to 15:1 — treat this one as a rough estimate, not a solid number.
SEO
Best for: Companies wanting predictable, low-cost moving leads over time
Expected ROI: 7.5:1
Average timeline: 4–8 months to see meaningful ranking movement
Here's the math:
-
General benchmark: 748% median ROI, or about 7.5:1, from a study of real SEO campaigns across many industries (First Page Sage)
We could not run the same formula here, and it's worth explaining why: SEO doesn't have a clean "cost per lead." You pay a monthly amount for someone to build your website and content, not a fee each time a lead comes in.
Netpeak lists $5–$20 as the cost per SEO lead (Netpeak US), but that's the cost after you're already ranking well — it doesn't include the months of work it took to get there. Because those two numbers aren't measuring the same thing, we didn't force a calculation.
We kept the general 7.5:1 figure as the best available estimate for movers, unchanged.
Which state has the fastest-growing search demand for movers in 2026? Read our research to find out.
Email Marketing
Best for: Re-engaging past customers and nurturing seasonal leads
Expected ROI: 4:1–6:1
Average timeline: 1–3 months
Here's the math:
-
General benchmark: ~36:1 — the industry-standard figure, built almost entirely on companies (retail, subscription boxes) that email the same customer list and get them to buy again and again (Litmus)
Most people move once every several years. A moving company can't sell to the same email subscriber repeatedly the way a clothing brand can — that's the core assumption behind the 36:1 number, and it doesn't hold for movers. What email actually does for a mover is remind someone who already requested a quote to book with you during the roughly 2.5 days it typically takes them to decide (SmartMoving).
We lowered the adapted estimate to roughly 4:1–6:1. This is our judgment call based on that reasoning, not a calculation — no study publishes a moving-specific email ROI number.
Organic Reviews
Best for: Building trust and improving conversion on every other channel
Expected ROI: Reviews work by raising the close rate on every paid channel above, not by generating their own leads.
Average timeline: 2–3 months of consistent requests
Here's the math:
-
General benchmark: Not an ROI ratio to begin with — 93% of consumers read reviews before choosing a local business (BrightLocal)
There's no dollar cost to divide by here — you're not paying per review — so there's no ratio to adapt.
The honest adaptation is qualitative: reviews work by raising the close rate on every paid channel above, not by generating their own leads. A mover with strong reviews will see a better return on the same Google Ads or LSA spend than one without.
Referral Programs
Best for: Lowest-cost, highest-close-rate leads
Expected ROI: "Roughly double the average close rate" — not a dollar ratio
Average timeline: Ongoing, builds with company reputation
Here's the math:
-
General benchmark: Also not a ratio — 88% of consumers say they trust a recommendation from someone they know over any paid ad (Nielsen).
Same issue as reviews: word of mouth is usually free, so there's nothing to divide a revenue number by. What we do have is a real comparison point: referral leads for movers close at 50%+, versus the 25% average close rate used throughout this article (Elromco).
The honest adapted number is "roughly double the average close rate" — not a dollar ratio.
Content Marketing
Best for: Long-term authority and compounding organic traffic
Expected ROI: This number is left completely unadapted
Average timeline: 6–12 months
Here's the math:
- General benchmark: 3x more leads than outbound marketing, at 62% lower cost, from a widely cited study (HubSpot, citing Demand Metric)
We looked for moving-specific content marketing data and found none.
This number is left completely unadapted — it's the general cross-industry figure, presented as-is, because pretending otherwise would mean making up a number with nothing behind it.
FAQ
How long does it take to see positive marketing ROI?
Paid channels like Google Ads and Local Service Ads can turn profitable within 1–2 months. Organic channels like SEO and content marketing typically take 6–12 months — they depend on search rankings building over time. Also, customers find movers through AI in 2026, so don't underestimate this lead channel as well.
What factors affect marketing ROI for movers?
The biggest factors are geography and competition; for example, dense metros like Chicago and Boston drive cost per lead up fast. Here is some research on why customers choose one moving company over another.
How to improve marketing ROI for movers?
Here are trends to follow: tighten your negative keyword list to cut irrelevant clicks, improve landing page speed with a single clear call to action, follow up on leads within 5 minutes (one of the biggest conversion levers in the industry), test ad copy monthly, and build your review base consistently since it converts more traffic without raising cost per click (Netpeak US).

 0
0
 0
0
 0
0
 0
0
Related Articles
Amazon's AI Now Builds Complete Looks on Product Pages. How Do Brands Make Sure the Bundle Is Theirs?
Amazon now uses AI to assemble complete, shoppable looks around a single product, and it fills those looks with whichever brands its model picks.
What Happens When Amazon Suppresses Your Listing? The New 2026 Rules
Under the new 2026 rules, Amazon warns you first and gives you a grace period to fix the issue.
Business Apps in the US: iOS vs. Android, August 2026
We’ve fetched data from the US App Store and Google Play to see what professionals, shoppers, and businesses are actually installing, and why the market leaders are winning right now.