
How We Created a Web Analytics Tool for an E-Commerce Website
Niche: E-commerce.
Results: A handy tool for web analytics developed within 27 hours.
The Challenge
In November 2014, we were contacted by a company that wanted to have its website analyzed. The company wanted to get answers to non-trivial questions, specifically in the form of reports that could not be compiled on Google Analytics. At the same time, there was a lack of understanding on the kind of reports that would answer the questions posed by our client.
Together, we compiled a list of parameters and metrics that would be necessary to obtain these answers. We also developed a system of automatically updated non-trivial reports. This file would update all reports on a daily basis as soon as they were opened. The data visualization was connected to the daily updated MySQL database duplicated from Google Analytics through API.
This project became part of our Web Analytics Services & Consultancy offering, where we solve complex analytical tasks by combining custom reporting, automation, and data visualization.
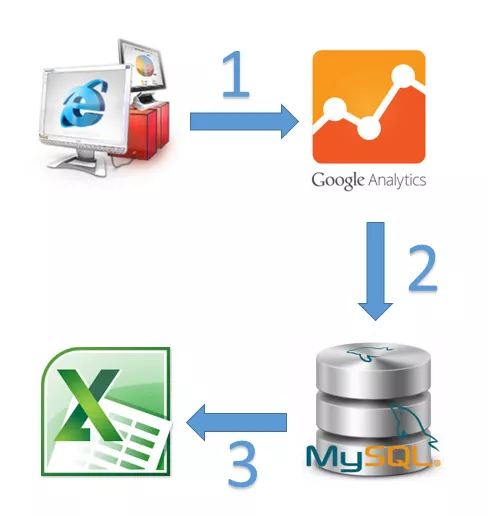
The scheme of data collection, aggregation, and visualization.
- Google Analytics collects information about all sessions on the website.
- Through API, the information collected on Google Analytics is aggregated and exported to the MySQL database.
- An Excel file is then connected to the MySQL database. Every time it is opened, it sends a request to receive the updated data while at the same time updating all tables and diagrams.
The Solution
- We established a MySQL database containing all the information that our client wanted to analyze.
- We also wrote a script to update the database daily with data from the previous day.
- We divided traffic into the categories of activities, involvement, and type of visitor.
Involvement categories:
- Non-involved (sessions that lasted no longer than 60 seconds).
- Interested (sessions that lasted from 60 to 180 seconds).
- Involved (sessions that lasted longer than 180 seconds).
Visitor activity categories:
- New visitors (number of days since the last visit — 0).
- Visitors active during the last two weeks (number of days since the last visit — 1 to 30).
- Visitors that have come back to the website after two weeks (number of days since the last visit — over 30).
Type of visitor categories:
- Signed-in visitors (those who had signed-in but did not visit their personal account (PA)).
- Users of personal account (those who had visited their PA).
- Other visitors (those who had not visited their PA).
Website version categories:
- PC.
- Mobile.
Language preference categories:
- RU (Russian).
- KZ (Kazakh).
Type of device categories:
- Desktop.
- Mobile.
- Tablet.
- We set up data visualization with a possibility to use different filters in the Excel file that was connected to the MySQL database. All reports in this file were automatically updated every 24 hours.
It took us 24 hours to work towards this BI solution. We set up the process of collecting data from Google Analytics directly into the MySQL database.
Web analytics underpins conversion optimization. What will CRO get you? Find out with Netpeak's calculator.

The Results
Our solution enabled the client to:
- Check the volume of traffic and behavioral parameters by day.
- Present the segmentation of visitors in the form of a report.
- Present the segmentation of visitors in the form of a diagram.
- Monitor changes in the behavioral parameters.
- See the value of new content.
- Compare the indicators of a particular website page.
Read more:

 8
 2
 4
 2
Related Articles
Business Apps in the US: iOS vs. Android, October 2026
Which business apps did Americans actually download in October 2026? We pulled US data from the App Store and Google Play to find out what professionals, gig workers, shoppers, and investors installed.
Black Friday Marketing 2026 in Europe: How to Win the Season Before It Starts
Google surveyed thousands of European shoppers about Black Friday 2026: when they buy, which discounts work, and where they find deals. Plus an 8-week Black Friday marketing plan to win the season.
Shoppable YouTube: How to Make Every Screen Shoppable
Shoppable YouTube turns your video ads into mini storefronts by adding clickable products from your Merchant Center catalog.