
Which Amazon Categories Are Growing Fastest in 2026?
Grocery & Gourmet Food, Clothing, Shoes & Jewelry, and Beauty & Personal Care are the fastest-growing product categories on Amazon in 2026 (PMG’s Amazon US research). Their estimated revenue grew 32%, 27%, and 22%, respectively, in Q2 2026 compared with Q2 2025.
To explore demand within these categories more deeply, we selected products from Amazon’s September 2026 guide and checked their growth potential using Google Trends:
-
Grocery & Gourmet Food: Сrackers (+20%)
-
Clothing, Shoes & Jewelry: Crocs (+4%) and jeans (+29%)
-
Beauty & Personal Care: Acne patches (+61%) and hair extensions (+46%)
What Are the Fastest-Growing Amazon Categories in 2026?
|
Estimated Amazon revenue growth, Q2 2026 YoY |
Examples from Amazon’s guide |
Google search-interest growth, Jan–Sep 2026 YoY |
|
|
Grocery & Gourmet Food |
+32% |
Crackers |
+20% |
|
Clothing, Shoes & Jewelry |
+27% |
Crocs; jeans |
+4%; +29% |
|
Beauty & Personal Care |
+22% |
Acne patches; hair extensions |
+61%; +46% |
Sources: PMG, Amazon, and our Google Trends calculations. These are three leaders among categories with published comparable estimates, not a complete ranking of every Amazon category
How Did We Get This Data?
-
Found growing categories in PMG’s analysis of more than 30 million Amazon US products, comparing April–June 2026 with April–June 2025.
-
Selected examples from the Amazon guide. Its guide features products drawn from Best Sellers and Most Wished For lists. We used only the examples it names for our three categories: one grocery example and two each for apparel and beauty.
-
Checked Google Trends search interest for each product with the same settings:
-
US Web Search
-
All categories
-
January–September 2026 versus January–September 2025
-
Calculate growth rates and stability. We compared the average weekly interest rates for these periods and calculated how many months showed growth compared to the same period last year.
Research Limitations: Google Trends uses sample data estimated on a scale from 0 to 100, rather than absolute figures for the number of search queries or sales volumes on Amazon. We grouped weeks by their start dates, using 39 observations per year.
Here are the category-specific Google Trends charts: crackers, Crocs and jeans, and acne patches and hair extensions.
Grocery & Gourmet Food: Crackers
PMG estimated 32% revenue growth for grocery, the highest rate among our three selected categories. We chose crackers because Amazon lists them as a high-demand grocery example.
In our Google Trends analysis of crackers, the average index increased from 55.26 to 66.33, approximately 20%. Interest increased in all nine monthly comparisons.
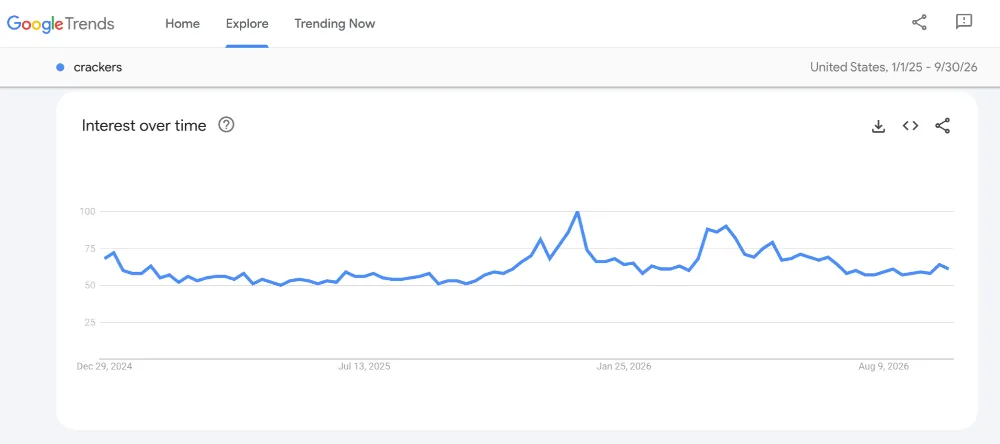
This points to a fairly consistent increase in Google interest. The query is broad, however, and may include recipes or other meanings alongside shopping searches.
Clothing, Shoes & Jewelry: Crocs and Jeans
PMG estimated revenue growth in this category at 27%. We chose Crocs and jeans because both of these products are mentioned in the Amazon guide.
Our search comparison found different patterns:
-
Crocs: average interest rose from 10.74 to 11.21, approximately 4%, with increases in five months.
-
Jeans: average interest rose from 41.26 to 53.26, approximately 29%, with increases in seven months.
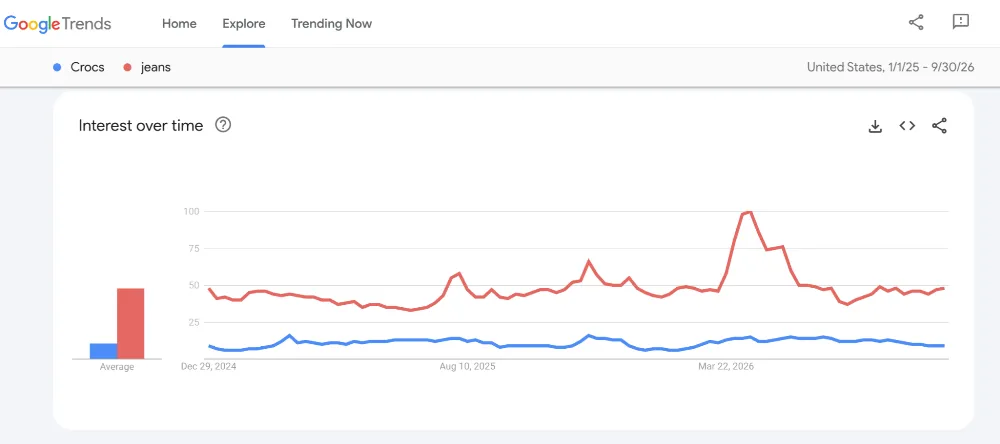
Jeans showed more significant growth in search queries and greater stability over the course of the month. The example of Crocs illustrates why popularity and growth are different concepts: a product can remain in demand, while search interest in it changes only slightly.
Furthermore, “Crocs” is a search query for a specific brand, so it should not be considered an indicator for the entire footwear segment.
Beauty & Personal Care: Acne Patches and Hair Extensions
PMG estimated 22% category revenue growth. Amazon highlights acne patches, including Mighty Patch, and hair extensions, giving us two directly sourced examples.
Our beauty-only comparison showed:
-
Acne patches: average interest increased from 2.13 to 3.44, approximately 61%, with increases in eight months.
-
Hair extensions: average interest increased from 34.64 to 50.46, approximately 46%, with increases in all nine months.
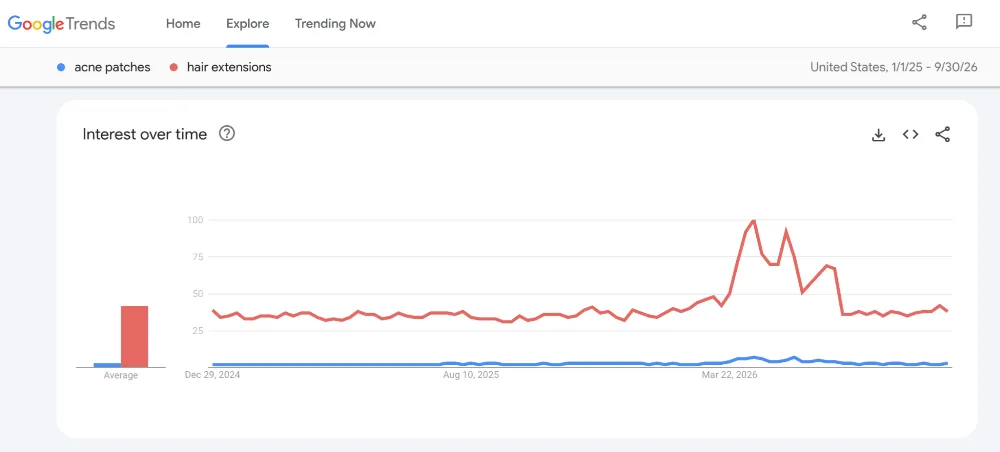
Acne patches had faster percentage growth, while hair extensions showed greater monthly consistency. The acne-patch estimate is more sensitive to rounding because its index is lower.
Considering Beauty & Personal Care? Check the cost of advertising beauty products on Amazon before deciding how much of that growing demand you can profitably pursue.
What does this mean for your business?
You need to research the product, not just the category. A growing category is a useful starting point, but demand can vary between products.
And don’t forget that more searches don’t guarantee more sales or profit. Calculate your product, shipping, Amazon, margins, and advertising costs before investing.
Read more Amazon insights in our expert overviews:
What Should Sellers Check Before Entering a Growing Category?
-
Identify a customer need that competitors haven’t yet met. Compare existing products, reviews, and common complaints. Use customer reviews on Amazon and niche analytics to identify useful improvements, such as a better size range, clearer instructions, or a missing feature.
-
Calculate how much you’ll actually earn. Factor in the costs of purchasing, shipping, Amazon fees, advertising, storage, and returns. Start with Amazon’s revenue calculator, and then add the expenses it doesn’t automatically account for.
-
Make sure you are authorized to sell this product. Before purchasing inventory, review the requirements for authorization to sell and any restrictions. Amazon’s product compliance guideline states that products must comply with applicable laws and Amazon’s policies.
-
Find out why customers return similar products. Even a popular product may not be profitable to sell if customers frequently return it. Analyze return statistics and customer reviews using the Product Opportunity Explorer tool, and then address common issues before launching the product.
Find Your Next Amazon Growth Opportunity
A growing category gives you a starting point. Netpeak USA can help you assess your niche, improve your listings, and build an Amazon advertising strategy around your business goals. Discuss how to promote products on Amazon with Netpeak USA:
And read some deep dives about the BTS of Amazon too to prep for Q1 2027:

 0
 0
 0
 0
Related Articles
Black Friday Marketing 2026 in Europe: How to Win the Season Before It Starts
Google surveyed thousands of European shoppers about Black Friday 2026: when they buy, which discounts work, and where they find deals. Plus an 8-week Black Friday marketing plan to win the season.
Shoppable YouTube: How to Make Every Screen Shoppable
Shoppable YouTube turns your video ads into mini storefronts by adding clickable products from your Merchant Center catalog.
What Is the Average Amazon PPC Cost in 2026 by Category?
Explore average Amazon PPC costs in 2026 by category, including CPC and ACoS, to help sellers plan and optimize ad spend.